

Effects of metformin and weight loss on serum alanine aminotransferase activity in the diabetes prevention program
- PMID: 20186137
- PMCID: PMC3135003
- DOI: 10.1038/oby.2010.21
Effects of metformin and weight loss on serum alanine aminotransferase activity in the diabetes prevention program
Abstract
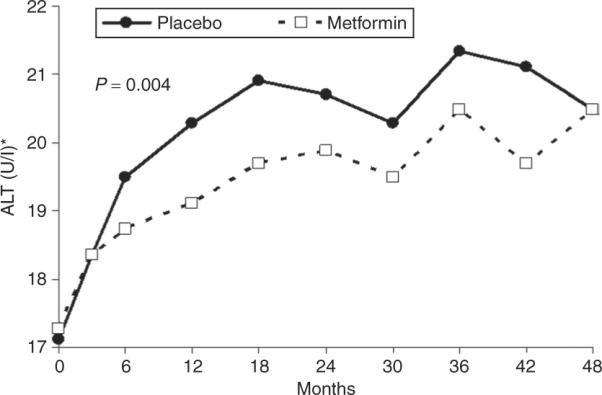
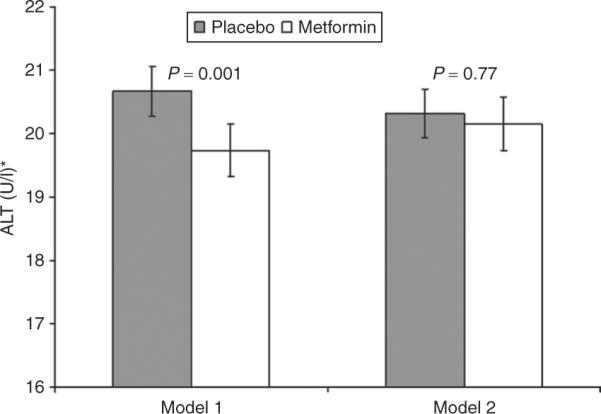
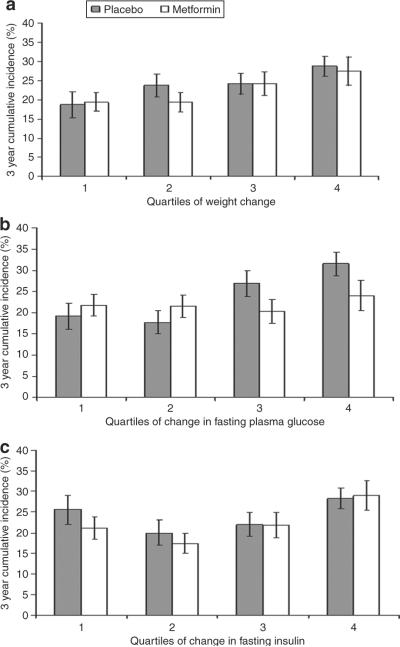
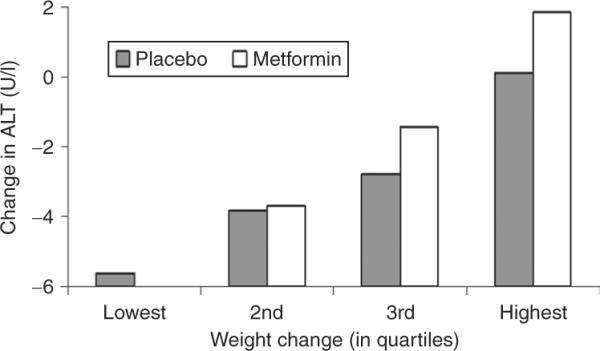
Nonalcoholic fatty liver disease (NAFLD) is associated with obesity, insulin resistance, and impaired glucose tolerance. We investigated whether metformin or changes in metabolic measurements (weight, fasting plasma glucose (FPG), or fasting insulin (FI)) improved serum alanine aminotransferase (ALT) activity, as a marker for NAFLD, in the Diabetes Prevention Program (DPP). From 1996 to 1999, 2,153 participants without marked elevations of serum ALT at baseline were randomized (1,081 to placebo, 1,072 to metformin) and treated for an average of 3.2 years. ALT increased during the first 2 years of the study, and was slightly but significantly lower in the participants randomized to metformin. In regression models adjusted for sex, baseline age, FPG, and FI, these differences remained significant, but disappeared after adjustment for weight, FPG, and FI changes at each examination. The 3-year cumulative incidence for development of abnormal ALT concentrations was not significantly different ((mean +/- s.e.) 21.4 +/- 1.4% and 24.6 +/- 1.4%, P = 0.11) in the metformin vs. placebo groups but was lower in individuals in both groups that lost more weight by the end of year 1 (metformin: 19.4 +/- 2.4% vs. 27.5 +/- 3.7%, for highest vs. lowest quartile of weight loss; placebo: 18.7 +/- 3.4% vs. 28.8 +/- 2.6%). Over 3 years of follow-up in persons at high risk for development of diabetes, serum ALT was consistently lower in those treated with metformin compared with placebo. This effect was mediated by weight loss, indicating that the effects of metformin therapy on ALT is via its effects on weight.
Figures
References
-
- Clark JM, Brancati FL, Diehl AM. The prevalence and etiology of elevated aminotransferase levels in the United States. Am J Gastroenterol. 2003;98:960–967. - PubMed
-
- Ioannou GN, Boyko EJ, Lee SP. The prevalence and predictors of elevated serum aminotransferase activity in the United States in 1999–2002. Am J Gastroenterol. 2006;101:76–82. - PubMed
-
- Ruhl CE, Everhart JE. Determinants of the association of overweight with elevated serum alanine aminotransferase activity in the United States. Gastroenterology. 2003;124:71–79. - PubMed
-
- Clark JM. The epidemiology of nonalcoholic fatty liver disease in adults. J Clin Gastroenterol. 2006;40(Suppl 1):S5–10. - PubMed
-
- American Gastroenterological Association medical position statement: nonalcoholic fatty liver disease. Gastroenterology. 2002;123:1702–1704. - PubMed
Publication types
MeSH terms
Substances
Grants and funding
LinkOut - more resources
Full Text Sources
Medical
