Influence of genetic background and tissue types on global DNA methylation patterns
- PMID: 20186319
- PMCID: PMC2826396
- DOI: 10.1371/journal.pone.0009355
Influence of genetic background and tissue types on global DNA methylation patterns
Abstract
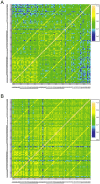
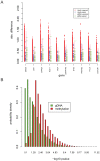
Recent studies have shown a genetic influence on gene expression variation, chromatin, and DNA methylation. However, the effects of genetic background and tissue types on DNA methylation at the genome-wide level have not been characterized extensively. To study the effect of genetic background and tissue types on global DNA methylation, we performed DNA methylation analysis using the Affymetrix 500K SNP array on tumor, adjacent normal tissue, and blood DNA from 30 patients with esophageal squamous cell carcinoma (ESCC). The use of multiple tissues from 30 individuals allowed us to evaluate variation of DNA methylation states across tissues and individuals. Our results demonstrate that blood and esophageal tissues shared similar DNA methylation patterns within the same individual, suggesting an influence of genetic background on DNA methylation. Furthermore, we showed that tissue types are important contributors of DNA methylation states.
Conflict of interest statement
Figures


Similar articles
-
Pyrosequencing assay to measure LINE-1 methylation level in esophageal squamous cell carcinoma.Ann Surg Oncol. 2012 Aug;19(8):2726-32. doi: 10.1245/s10434-011-2176-3. Epub 2011 Dec 21. Ann Surg Oncol. 2012. PMID: 22187122
-
Chromosomal instability associated with global DNA hypomethylation is associated with the initiation and progression of esophageal squamous cell carcinoma.Ann Surg Oncol. 2014 Dec;21 Suppl 4:S696-702. doi: 10.1245/s10434-014-3818-z. Epub 2014 Jun 5. Ann Surg Oncol. 2014. PMID: 24898425
-
Methylation of RASSF1A gene promoter and the correlation with DNMT1 expression that may contribute to esophageal squamous cell carcinoma.World J Surg Oncol. 2015 Apr 8;13:141. doi: 10.1186/s12957-015-0557-y. World J Surg Oncol. 2015. PMID: 25886188 Free PMC article.
-
UHRF1 regulates global DNA hypomethylation and is associated with poor prognosis in esophageal squamous cell carcinoma.Oncotarget. 2016 Sep 6;7(36):57821-57831. doi: 10.18632/oncotarget.11067. Oncotarget. 2016. PMID: 27507047 Free PMC article.
-
LINE-1 hypomethylation is associated with a poor prognosis among patients with curatively resected esophageal squamous cell carcinoma.Ann Surg. 2013 Mar;257(3):449-55. doi: 10.1097/SLA.0b013e31826d8602. Ann Surg. 2013. PMID: 23023202
Cited by
-
A prospective study of LINE-1DNA methylation and development of adiposity in school-age children.PLoS One. 2013 Apr 30;8(4):e62587. doi: 10.1371/journal.pone.0062587. Print 2013. PLoS One. 2013. PMID: 23638120 Free PMC article.
-
Integrated transcriptome and methylome analysis in youth at high risk for bipolar disorder: a preliminary analysis.Transl Psychiatry. 2017 Mar 14;7(3):e1059. doi: 10.1038/tp.2017.32. Transl Psychiatry. 2017. PMID: 28291257 Free PMC article.
-
Integrative genomic analysis identifies epigenetic marks that mediate genetic risk for epithelial ovarian cancer.BMC Med Genomics. 2014 Jan 30;7:8. doi: 10.1186/1755-8794-7-8. BMC Med Genomics. 2014. PMID: 24479488 Free PMC article.
-
DNA methylation: an epigenetic risk factor in preterm birth.Reprod Sci. 2012 Jan;19(1):6-13. doi: 10.1177/1933719111424446. Reprod Sci. 2012. PMID: 22228737 Free PMC article. Review.
-
Allele-specific DNA methylation: beyond imprinting.Hum Mol Genet. 2010 Oct 15;19(R2):R210-20. doi: 10.1093/hmg/ddq376. Epub 2010 Sep 20. Hum Mol Genet. 2010. PMID: 20855472 Free PMC article. Review.
References
-
- Bird A, Macleod D. Reading the DNA methylation signal. Cold Spring Harb Symp Quant Biol. 2004;69:113–118. - PubMed
-
- Jenuwein T, Allis CD. Translating the histone code. Science. 2001;293:1074–1080. - PubMed
-
- Jones PA, Baylin SB. The fundamental role of epigenetic events in cancer. Nat Rev Genet. 2002;3:415–428. - PubMed
-
- Feinberg AP, Tycko B. The history of cancer epigenetics. Nat Rev Cancer. 2004;4:143–153. - PubMed
-
- Feinberg AP, Vogelstein B. Hypomethylation distinguishes genes of some human cancers from their normal counterparts. Nature. 1983;301:89–92. - PubMed
Publication types
MeSH terms
Substances
Associated data
- Actions
Grants and funding
LinkOut - more resources
Full Text Sources
Other Literature Sources
Medical
Molecular Biology Databases

