

Towards a rigorous assessment of systems biology models: the DREAM3 challenges
- PMID: 20186320
- PMCID: PMC2826397
- DOI: 10.1371/journal.pone.0009202
Towards a rigorous assessment of systems biology models: the DREAM3 challenges
Erratum in
- PLoS One. 2010;5(3). doi: 10.1371/annotation/f633213a-dc4f-4bee-b6c5-72d50e7073b8
Abstract
Background: Systems biology has embraced computational modeling in response to the quantitative nature and increasing scale of contemporary data sets. The onslaught of data is accelerating as molecular profiling technology evolves. The Dialogue for Reverse Engineering Assessments and Methods (DREAM) is a community effort to catalyze discussion about the design, application, and assessment of systems biology models through annual reverse-engineering challenges.
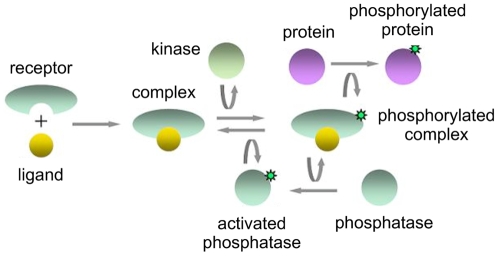
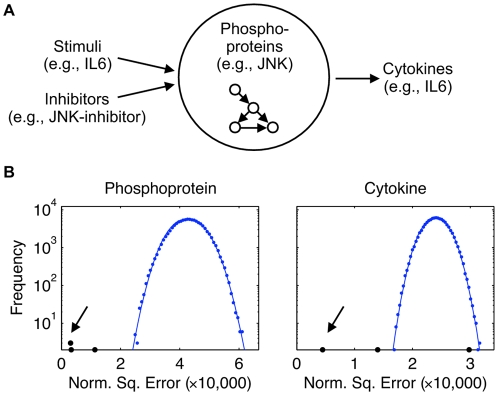
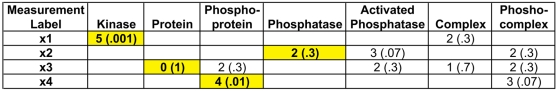
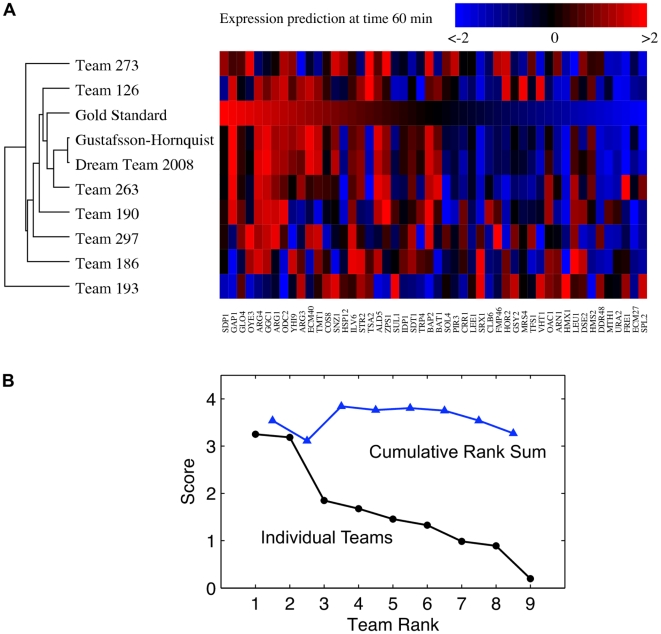
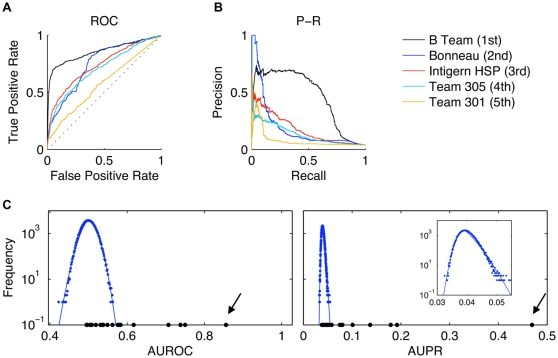
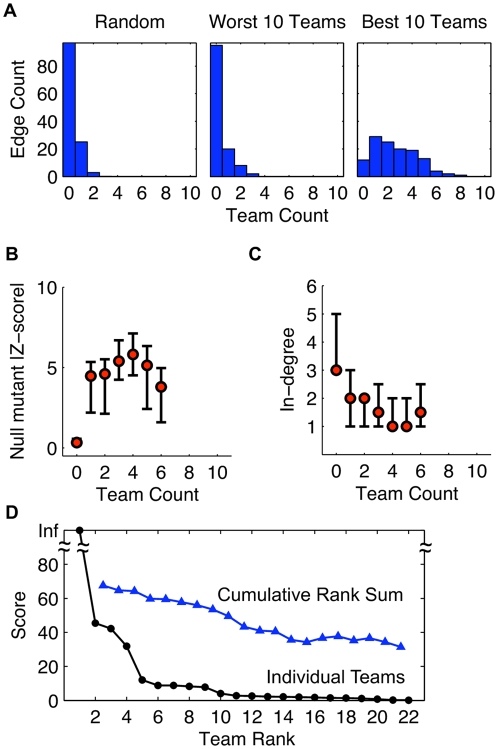
Methodology and principal findings: We describe our assessments of the four challenges associated with the third DREAM conference which came to be known as the DREAM3 challenges: signaling cascade identification, signaling response prediction, gene expression prediction, and the DREAM3 in silico network challenge. The challenges, based on anonymized data sets, tested participants in network inference and prediction of measurements. Forty teams submitted 413 predicted networks and measurement test sets. Overall, a handful of best-performer teams were identified, while a majority of teams made predictions that were equivalent to random. Counterintuitively, combining the predictions of multiple teams (including the weaker teams) can in some cases improve predictive power beyond that of any single method.
Conclusions: DREAM provides valuable feedback to practitioners of systems biology modeling. Lessons learned from the predictions of the community provide much-needed context for interpreting claims of efficacy of algorithms described in the scientific literature.
Conflict of interest statement
Figures

Similar articles
-
A top-performing algorithm for the DREAM3 gene expression prediction challenge.PLoS One. 2010 Feb 4;5(2):e8944. doi: 10.1371/journal.pone.0008944. PLoS One. 2010. PMID: 20140212 Free PMC article.
-
Lessons from the DREAM2 Challenges.Ann N Y Acad Sci. 2009 Mar;1158:159-95. doi: 10.1111/j.1749-6632.2009.04497.x. Ann N Y Acad Sci. 2009. PMID: 19348640
-
Inferring causal molecular networks: empirical assessment through a community-based effort.Nat Methods. 2016 Apr;13(4):310-8. doi: 10.1038/nmeth.3773. Epub 2016 Feb 22. Nat Methods. 2016. PMID: 26901648 Free PMC article.
-
Dialogue on reverse-engineering assessment and methods: the DREAM of high-throughput pathway inference.Ann N Y Acad Sci. 2007 Dec;1115:1-22. doi: 10.1196/annals.1407.021. Epub 2007 Oct 9. Ann N Y Acad Sci. 2007. PMID: 17925349 Review.
-
Integrated inference and analysis of regulatory networks from multi-level measurements.Methods Cell Biol. 2012;110:19-56. doi: 10.1016/B978-0-12-388403-9.00002-3. Methods Cell Biol. 2012. PMID: 22482944 Free PMC article. Review.
Cited by
-
An integrated approach to reconstructing genome-scale transcriptional regulatory networks.PLoS Comput Biol. 2015 Feb 27;11(2):e1004103. doi: 10.1371/journal.pcbi.1004103. eCollection 2015 Feb. PLoS Comput Biol. 2015. PMID: 25723545 Free PMC article.
-
Summary of the DREAM8 Parameter Estimation Challenge: Toward Parameter Identification for Whole-Cell Models.PLoS Comput Biol. 2015 May 28;11(5):e1004096. doi: 10.1371/journal.pcbi.1004096. eCollection 2015 May. PLoS Comput Biol. 2015. PMID: 26020786 Free PMC article.
-
A regulatory network modeled from wild-type gene expression data guides functional predictions in Caenorhabditis elegans development.BMC Syst Biol. 2012 Jun 26;6:77. doi: 10.1186/1752-0509-6-77. BMC Syst Biol. 2012. PMID: 22734688 Free PMC article.
-
A New Drug Combinatory Effect Prediction Algorithm on the Cancer Cell Based on Gene Expression and Dose-Response Curve.CPT Pharmacometrics Syst Pharmacol. 2015 Feb;4(2):e9. doi: 10.1002/psp4.9. Epub 2015 Feb 19. CPT Pharmacometrics Syst Pharmacol. 2015. PMID: 26225234 Free PMC article.
-
Network-based approaches for understanding gene regulation and function in plants.Plant J. 2020 Oct;104(2):302-317. doi: 10.1111/tpj.14940. Epub 2020 Aug 28. Plant J. 2020. PMID: 32717108 Free PMC article. Review.
References
-
- David LA, Wiggins CH. Benchmarking of dynamic bayesian networks inferred from stochastic time-series data. Ann N Y Acad Sci. 2007;1115:90–101. - PubMed
-
- Camacho D, Vera Licona P, Mendes P, Laubenbacher R. Comparison of reverse-engineering methods using an in silico network. Ann N Y Acad Sci. 2007;1115:73–89. - PubMed
-
- Cantone I, Marucci L, Iorio F, Ricci MA, Belcastro V, et al. A yeast synthetic network for in vivo assessment of reverse-engineering and modeling approaches. Cell. 2009;137:172–181. - PubMed
Publication types
MeSH terms
Grants and funding
LinkOut - more resources
Full Text Sources
Other Literature Sources
