. 2010 Feb 23;5(2):e9364.
doi: 10.1371/journal.pone.0009364.

Non-invasive detection of a small number of bioluminescent cancer cells in vivo

Affiliations

Non-invasive detection of a small number of bioluminescent cancer cells in vivo

Jae-Beom Kim et al. PLoS One. .

Abstract

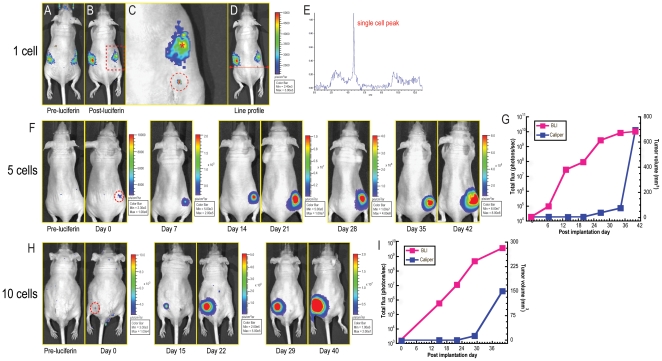
Early detection of tumors can significantly improve the outcome of tumor treatment. One of the most frequently asked questions in cancer imaging is how many cells can be detected non-invasively in a live animal. Although many factors limit such detection, increasing the light emission from cells is one of the most effective ways of overcoming these limitations. Here, we describe development and utilization of a lentiviral vector containing enhanced firefly luciferase (luc2) gene. The resulting single cell clones of the mouse mammary gland tumor (4T1-luc2) showed stable light emission in the range of 10,000 photons/sec/cell. In some cases individual 4T1-luc2 cells inserted under the skin of a nu/nu mouse could be detected non-invasively using a cooled CCD camera in some cases. In addition, we showed that only few cells are needed to develop tumors in these mice and tumor progression can be monitored right after the cells are implanted. Significantly higher luciferase activity in these cells allowed us to detect micrometastases in both, syngeneic Balb/c and nu/nu mice.


Conflict of interest statement

Competing Interests: Jae-Beom Kim, Konnie Urban, Steve Lee, Bradley Rice, Adam Bata, Kenneth Campbell, Richard Coffee, Alex Gorodinsky, Zhan Lu and Peter Lassota are employees of Caliper Life Sciences. He Zhou, Edward Cochran and Takashi Kei Kishimoto are employees of Momenta Pharmaceuticals Inc. The authors agree to PLoS One Policy on data sharing policies. There is no patent application filed using the data obtained from this study.

Figures

Figure 1
Figure 1. Generation of 4T1-luc2-1A4 cells and their growth patterns in the presence or absence of D-luciferin.
(A) Generation of 4T1-luc2-1A4 cells. Mouse mammary tumor 4T1 cells were transfected with a lentiviral vector containing enhanced luciferase 2 under control of the human ubiquitin C promoter, . Puromycin-resistant clones were isolated and their luciferase expressions were screened by bioluminescence. Two rounds of cloning generated 4 single cell clones of 4T1-luc2. Luciferase activities were measured using an IVIS Spectrum (Binning: med, f stop: 1, exposure time: 1 sec). A typical bioluminescence image for testing stability of luciferase expression is shown. Total flux (photons/sec) was quantified using Living Image software 3.0. Clone 4T1-luc2-1A4 was selected and used for further studies. (B) Stability of luciferase activity of four 4T1-luc2 clones. Cells were grown for 6 weeks in regular media without puromycin and their light emission was monitored weekly. All clones showed more than 7,000 photons/sec/cell of light emission throughout the test period. (C) Growth curves of the 4T1-luc2-1A4 clone and parental 4T1 cells. Cells were grown for 4 days in regular growth medium without puromycin. Total numbers of cells over time were plotted in a logarithmic scale. Both cell lines showed similar growth patterns and doubling times. (D,E) Growth of the 4T1-luc2-1A4 clone and parental 4T1 cells in the presence of D-luciferin. Cells were fed with D-luciferin once a day (150 µg/ml/day, D) or twice a day (300 µg/ml/day, E), respectively, harvested at each time point and counted. Presence of the excess of D-luciferin did not affect the overall growth patterns of the 4T1-luc2 cells.
Figure 2
Figure 2. Detection of small numbers of 4T1-luc2-1A4 cells in vivo.
(A-D) Defined numbers of cells were implanted subcutaneously in dorsal flank regions of female nu/nu mice. Each mouse received two implantations. Insets indicate the number of cells implanted. D-luciferin was injected into mice immediately after the implantation and bioluminescent images were taken (t = 0) using an IVIS Spectrum (FOV; A, binning; small, f stop; 1, exposure time; 5 min). (E-H) After 6 hours of implantation, all mice were re-imaged using the same settings of IVIS Spectrum (t = 6h). Red circles represent the implantation sites that had bioluminescent signals higher than autoluminescence. Yellow circles indicate the implantation sites that did not generate any meaningful signals possibly due to immediate cell death. (I) Correlation between the number of implanted cells and the total flux from the implantation sites. Bioluminescent signals were quantitated using Living Image software 3.0 and plotted against the numbers of cells. The measured intensity of bioluminescence was directly proportional to the number of implanted cells. Asterisks (*) indicate tissue autoluminescence.
Figure 3
Figure 3. Detection of a single 4T1-luc2-1A4 cell in vivo.
(A-C) Bioluminescent signal of a single 4T1-luc2-1A4 cell in vivo. A single cell was implanted into the back of a nu/nu mouse. D-luciferin was injected into the mouse intraperitoneally and bioluminescent images were taken using an IVIS Spectrum (FOV; C, binning; small, f stop; 1, exposure time; 5 min). Images for pre- and post-luciferin injection were shown in panels (A) and (B), respectively. Magnified image of the dotted area from panel (B) is shown on panel (C). The dotted circle represents the single cell signal. The asterisk (*) indicates the background signal from the gut. (D,E) Line profiling analysis of single cell signal. Light emission was plotted along the line shown on panel (D). Peak signal in the panel (E) represents the light emission from a single 4T1-luc2-1A4 cell. (F) Tumor development from five 4T1-luc2-1A4 cells. Cells were implanted subcutaneously (using a micropipette) into the dorsal flank region of a nu/nu mouse. Bioluminescent images were first taken before the D-luciferin injection (Pre-luciferin). The animal was then imaged on day 0 through day 42. (G) Monitoring of tumor growth from 5 cells of 4T1-luc2-1A4. Bioluminescent signals were quantified using Living Image software and plotted against physical tumor volume measurements by a caliper. Tumor was not palpable till day 27 post-implantation while bioluminescent signals were detected from the day 0. Note that total flux was plotted in a logarithmic scale. (H) Tumor development from 10 cells of 4T1-luc2-1A4. Cells were implanted subcutaneously (using a micropipette) into the back of a nu/nu mouse. The background signal is shown in pre-D-luciferin injection image (Pre-luciferin). The tumor growth was monitored for 40 days using an IVIS Spectrum and a caliper. (I) Monitoring of tumor growth from 10 cells of 4T1-luc2-1A4. Tumor volumes were measured using a caliper and plotted against bioluminescent signals which were quantified using Living Image software. Tumor was not palpable till day 29 after implantation. On the contrary, bioluminescent signals were distinct from the day 0 of implantation.
Figure 4
Figure 4. Non invasive detection of micrometastases and histological analysis.
(A) Female nu/nu mice were inoculated with 5×10⁵ 4T1-luc2-1A4 cells orthotopically into the abdominal mammary fat pads. Bioluminescent images were taken longitudinally. At post-implantation day 27, micrometastases were detected in lungs (arrows) (B) The lungs were isolated at post-implantation day 27 and ex vivo image was taken. (C,D) Lung tissues were fixed in formalin and embedded in paraffin. H&E staining was performed and analyzed. Panel D represents the dotted area in panel C.
Figure 5
Figure 5. 4T1-luc2-1A4 tumor metastases in syngeneic Balb/c mice.
(A) Metastases of 4T1-luc2-1A4 tumors in Balb/c mice. 5.0×10⁴ cells were orthotopically implanted into mammary fat pads of the mice (n = 16). Ventral Images were taken at three time points post-implantation (PI-days: 4, 7, 8). Primary tumors were resected at PI-day 10 and images were taken again at various post-resection time points (PR-days: 5, 8, 12, 15, 19, 22). Two representative mice (C1M2 and C4M4) are shown. The apparent decrease of the bioluminescence signals at PR-day 12 was due to the adjustment of the color bar scale (see panel B). Primary tumor resection time point is indicated by the red line separating the pre-and pot-resection images. (B) Plots of bioluminescence signals vs. time for mice C1M2 and C4M4. Whole body bioluminescence signals of mice C1M2 (blue lines) and C4M4 (orange lines) were quantitated and plotted in a logarithmic scale. Quantitations of bioluminescence signals before and after resection of the primary tumors are shown.

Similar articles

Cited by

References

    1. Jenkins DE, Oei Y, Hornig YS, Yu SF, Dusich J, et al. Bioluminescent imaging (BLI) to improve and refine traditional murine models of tumor growth and metastasis. Clin Exp Metastasis. 2003;20:733–744. - PubMed
    1. Hirsch FR, Franklin WA, Gazdar AF, Bunn PA., Jr Early detection of lung cancer: clinical perspectives of recent advances in biology and radiology. Clin Cancer Res. 2001;7:5–22. - PubMed
    1. Holmgren L, O'Reilly MS, Folkman J. Dormancy of micrometastases: balanced proliferation and apoptosis in the presence of angiogenesis suppression. Nat Med. 1995;1:149–153. - PubMed
    1. Killion JJ, Radinsky R, Fidler IJ. Orthotopic models are necessary to predict therapy of transplantable tumors in mice. Cancer Metastasis Rev. 1998;17:279–284. - PubMed
    1. Vaupel P, Kallinowski F, Okunieff P. Blood flow, oxygen and nutrient supply, and metabolic microenvironment of human tumors: a review. Cancer Res. 1989;49:6449–6465. - PubMed

Publication types

MeSH terms