. 2010 Feb 23;5(2):e9367.
doi: 10.1371/journal.pone.0009367.

Reduced basal autophagy and impaired mitochondrial dynamics due to loss of Parkinson's disease-associated protein DJ-1

Affiliations

Reduced basal autophagy and impaired mitochondrial dynamics due to loss of Parkinson's disease-associated protein DJ-1

Guido Krebiehl et al. PLoS One. .

Abstract

Background: Mitochondrial dysfunction and degradation takes a central role in current paradigms of neurodegeneration in Parkinson's disease (PD). Loss of DJ-1 function is a rare cause of familial PD. Although a critical role of DJ-1 in oxidative stress response and mitochondrial function has been recognized, the effects on mitochondrial dynamics and downstream consequences remain to be determined.

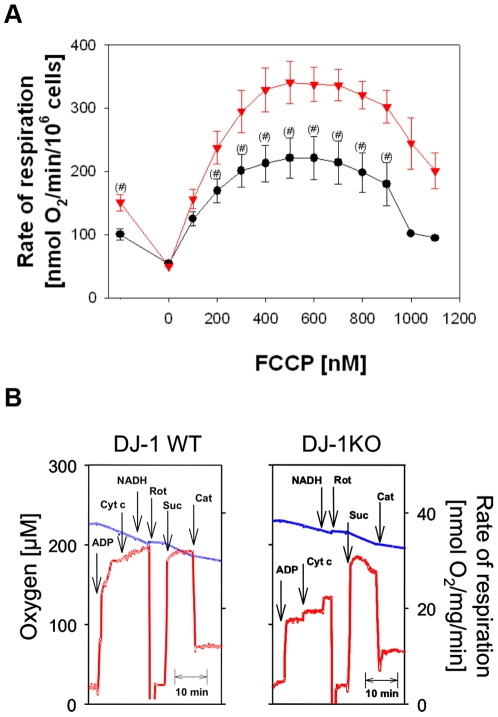
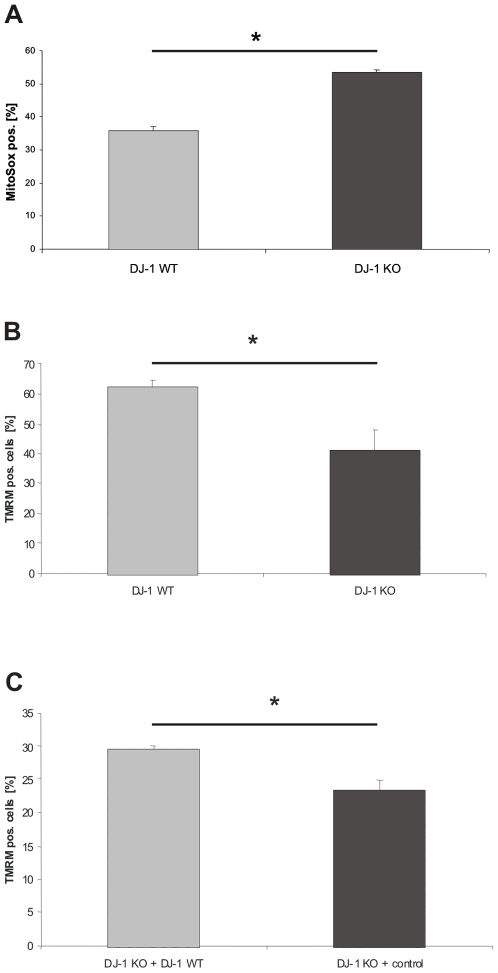
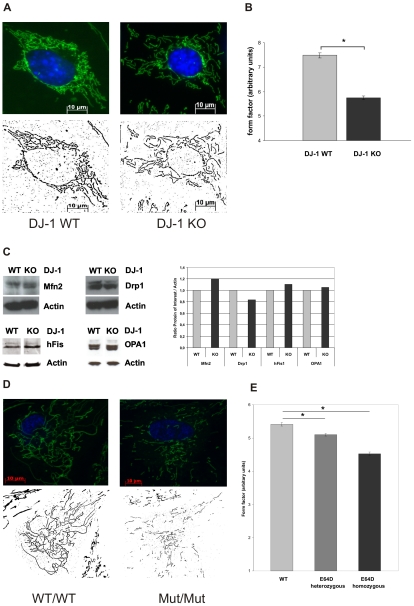
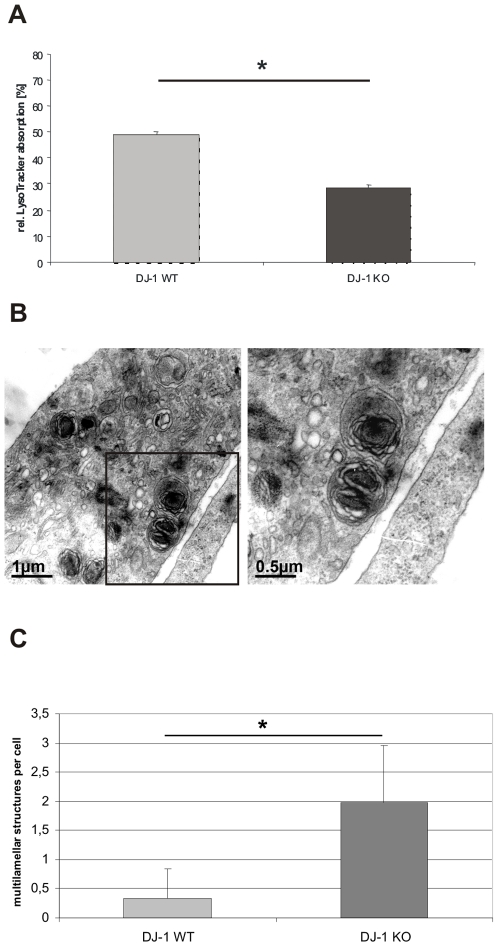
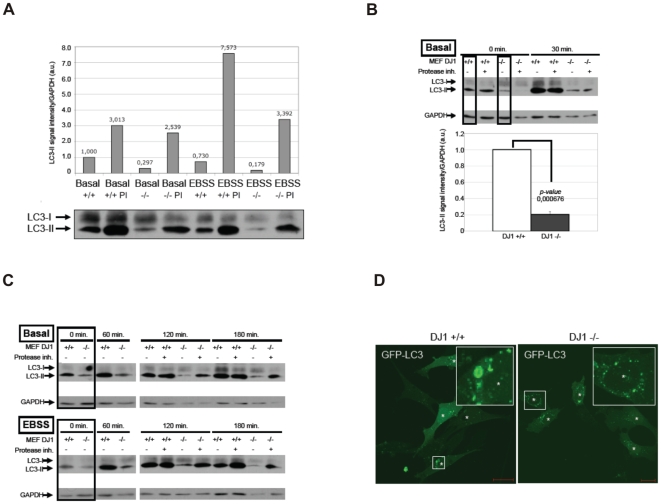
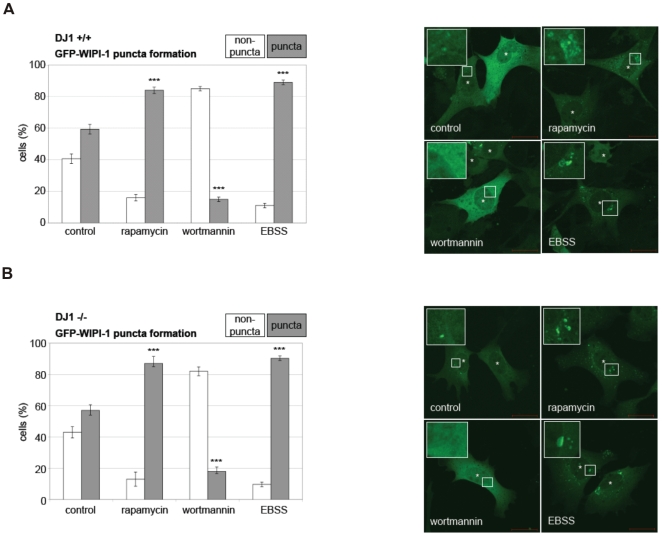
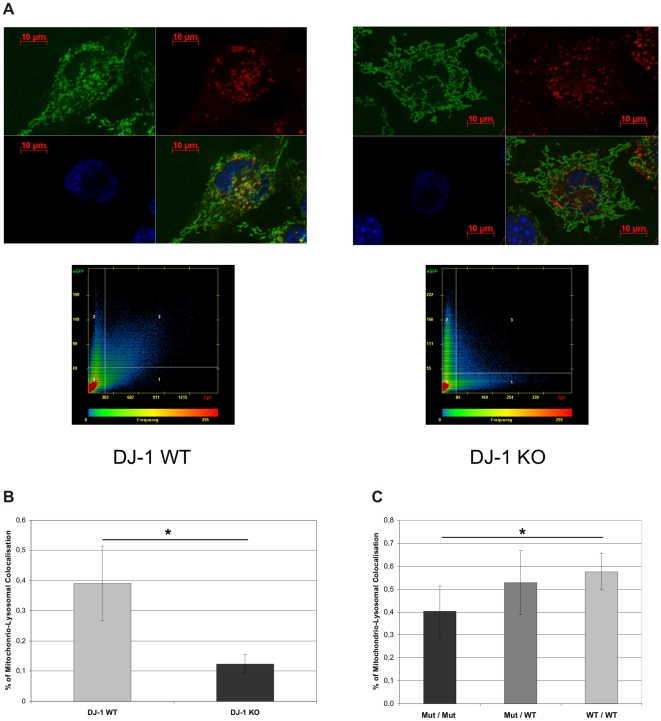
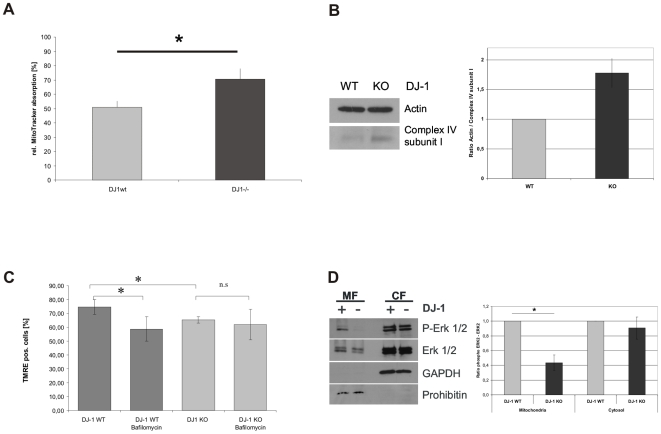
Methodology/principal findings: Using DJ-1 loss of function cellular models from knockout (KO) mice and human carriers of the E64D mutation in the DJ-1 gene we define a novel role of DJ-1 in the integrity of both cellular organelles, mitochondria and lysosomes. We show that loss of DJ-1 caused impaired mitochondrial respiration, increased intramitochondrial reactive oxygen species, reduced mitochondrial membrane potential and characteristic alterations of mitochondrial shape as shown by quantitative morphology. Importantly, ultrastructural imaging and subsequent detailed lysosomal activity analyses revealed reduced basal autophagic degradation and the accumulation of defective mitochondria in DJ-1 KO cells, that was linked with decreased levels of phospho-activated ERK2.

Conclusions/significance: We show that loss of DJ-1 leads to impaired autophagy and accumulation of dysfunctional mitochondria that under physiological conditions would be compensated via lysosomal clearance. Our study provides evidence for a critical role of DJ-1 in mitochondrial homeostasis by connecting basal autophagy and mitochondrial integrity in Parkinson's disease.


Conflict of interest statement

Competing Interests: One of the authors is employed by a commercial company, (i.e. KeyNeurotek Pharmaceuticals). This company therefore may formally act as a funder due to employment of one authors of this study. However, this funder did not play any role in this study, since only the expertise of FNG in terms of respirometry Figure 1 independently from his affiliation was subject of cooperation. Therefore no financial disclosure or specification of the role of the funder needs to be declared.

Figures

Figure 1
Figure 1. Respirometric detection of mitochondrial dysfunction in intact DJ-1 deficient and DJ-1 WT MEF cells.
(A) Mitochondrial oxygen consumption was measured with high resolution respirometry in freshly harvested MEF. Cells (2×10⁶ cells/ml) were incubated in a Hank's medium containing 10 mM pyruvate. Endogenous respiration was observed without any further additions. Oligomycin resistent respiration was followed in the presence of 10 µg/ml oligomycin. Then uncoupled respiration was measured by stepwise additions of 100 nM FCCP. Data as means ± SE of 13 (wild type MEF, ▾) and 11 (KO MEF, •) single incubations performed of 5 different cell preparations. DJ-1 KO MEF showed significantly reduced oxygen consumption compared to controls (#: p<0.05, one-way ANOVA). (B) Mitochondria were investigated by respirometry in cell homogenates of DJ-1 KO cells and WT controls using multiple substrate inhibitor titration. Measurements were performed in homogenates from 3×10⁶ cells/ml MMMPK buffer with 10 mM pyruvate and 2 mM malate as substrates (Additions: ADP, 5 mM ADP; Cyt c, 10 µM cytochrome c; NADH, 150 µM NADH; Rot, 1,5 µM rotenone, Suc, 10 mM succinate; Cat, 50 µM carboxyatractylate). Blue lines indicate the oxygen concentration in the oxygraph (left ordinate), red lines represent the first derivative of the oxygen time curve, directly indicating the rate of respiration (right ordinate). Typical respirograms from four independent experiments with similar results are shown. The state 3pyr/mal/state 3suc –ratio was 0.57±0,12 for DJ-1KO cells and 0.93±0,15% for WT cells (p<0.05).
Figure 2
Figure 2. Analysis of the integrity of mitochondria in DJ-1 deficient and DJ-1 WT MEF.
(A) To determine intramitochondrial ROS production, DJ-1 WT and DJ-1 KO cells were treated with MitoSox® (Invitrogen, USA) according to the manufacturer's instructions for 15 min at 37°C. Fluorescence emission was determined by FACS analysis. An increased intramitochondrial ROS production was observed in DJ-1 KO MEF compared to controls (p<0.05, Student's t-test). Mitochondrial membrane integrity was assessed in DJ-1 WT and KO MEF and in DJ-1 KO cells stably transfected with either DJ-1 WT or the corresponding empty control vector, respectively. The MMP was determined after treatment with TMRM (Invitrogen, USA) for 15 min. at 37°C. The absorption of TMRM in the mitochondria was used as a marker for the integrity of MMP and determined by FACS analysis. (B) A significantly decreased MMP was found in DJ-1 KO cells compared to controls (*p<0.001, Student's t-test). (C) Complementation of the DJ-1 KO phenotype with physiological DJ-1 significantly increased the MMP compared to empty vector control (*p<0.05, Student's t-test).
Figure 3
Figure 3. Effect of DJ-1 on mitochondrial morphology.
Mitochondrial morphology in living DJ-1 KO and DJ-1 WT MEF and in human fibroblasts from carriers of the E64D mutation in the DJ-1 gene and a healthy control were analyzed by life cell imaging microscopy (Cell Observer Z1, Zeiss, Germany) at 37°C using ApoTome®optical slides with 0.35–0.40 z-stacks. Mitochondria were stained with 200 nM MitoTracker® green FM (Invitrogen, USA), a specific mitochondrial dye, for 15 min at 37°C, nuclei were stained with Hoechst 33342 (Molecular Probes, USA; blue). (A) Fluorescence microscopy images of single mitochondria were analyzed using Image J 1.41o software (Wayne Rasband; National Institutes of Health, USA) for area, perimeter, major and minor axes. On the basis of these parameters, the aspect ratio (AR) of a mitochondrion (AR; ratio between the major and the minor axes of the ellipse equivalent to the object) and its form factor (FF; perimeter2/4π*area), consistent with the degree of branching, were calculated. (B) Mitochondrial branching as indicated by the form factor (FF) was significantly reduced in DJ-1 KO cells compared to WT (*p<0.001, Student's t-test). No significant differences in the AR were observed between DJ-1 KO cells and controls (not shown). Images from 45 individual cells were analyzed on three separate occasions by an investigator blinded to the experimental design. (C) Influence of DJ-1 on the expression of mitochondrial fission and fusion regulating proteins using WB analysis with specific antibodies against hFis1, OPA1, Drp1, and Mfn2. As a control for equal loading a specific antibody against β-actin was used. Densitometric quantification revealed no significant differences in the respective protein levels between WT and KO MEF. (D) Fluorescence microscopy images of single mitochondria of human fibroblasts from the E64D family and a healthy control (see supplemental figure S1) were analyzed using Image J 1.41o software (Wayne Rasband; National Institutes of Health, USA) as described previously. On the basis of these parameters, the aspect ratio (AR) of a mitochondrion (AR; ratio between the major and the minor axes of the ellipse equivalent to the object) and its form factor (FF; perimeter2/4π*area), consistent with the degree of branching, were calculated. (E) Mitochondrial branching as indicated by the form factor (FF) was significantly reduced in cells from the index patient carrying the homozygous E64D mutation compared to the healthy control (*p<0.001, Student's t-test). Also heterozygous carriers of the E64D mutation revealed a decreased form factor compared to control (*p<0.05, Student's t-test). Images from 40 individual cells of each proband were analyzed on three separate occasions by an investigator blinded to the experimental design.
Figure 4
Figure 4. Lysosomal phenotype in DJ-1 WT and DJ-1 deficient MEF.
(A) Lysosomal activity was determined by FACS analysis. Cells were stained with the specific lysosomal dye LysoTracker® (Invitrogen, USA) 1 µM for 15 min at 37°C. The absorption of LysoTracker® was measured by FACS. The uptake of LysoTracker® is an indicator of the Lysosomal mass. DJ-1 KO cells revealed a significantly reduced uptake of LysoTracker® compared to WT MEF (*p<0.0001, Student's t-test). The experiments were performed in triplicate on three different days, the diagram represents 1 of 3 sets of experiments with similar results. (B) Ultrastructural analyzes of DJ-1 deficient MEF and MEF from DJ-1 WT littermates were performed by electron microscopy. MEF lacking DJ-1 show multilamellar structures reminiscent of modified lysosomes. Bars 1 µm or 0,5 µm, respectively. (C) Quantification of lysosomal-like structures in DJ-1 WT and DJ-1 KO MEF. Multilamellar structured lysosomes were counted per cell and were significantly more frequent in DJ-1 KO cells compared to WT controls (p<0.001, Student's t-test). A total of 150 individual cells were evaluated for the presence of multilamellar structures.
Figure 5
Figure 5. Assessing basal autophagy by LC3 protein monitoring in DJ-1 WT and DJ-1 deficient MEF.
(A–C) LC3 protein monitoring reveals reduced basal autophagy in DJ-1 KO MEF. (A) WT (MEF DJ-1 +/+) or DJ-1 KO MEF (MEF DJ-1 −/−) were either left untreated (mock treatment, control) or were treated with medium lacking amino acids (EBSS) in the absence or presence of lysosomal inhibitors (PI) in the culture medium. Total protein extracts were analyzed by anti-LC3 WB. The increase of LC3-II normalized over GAPDH levels was quantified. (B, C) WT (MEF DJ-1 +/+) or DJ-1 KO MEF (MEF DJ-1 −/−) were pretreated with LY290042 for 3 hrs to reduce autophagy to a minimum basal level. Thereafter, in the presence or absence of lysosomal inhibitors (protease inh.) control medium was added to analyze basal autophagy, or EBSS was added to induce autophagy for the indicated period of time (min.). LC3 and GAPDH protein levels from total protein extracts are shown. (B) The decrease in basal autophagy is presented in the lower panel graph as follows. From three independet sets of experiments shown in C (boxed lanes in the upper and lower panels) and B (boxed lanes in the upper panel) were used to quantify the LC3-II signal intensity normalized over GAPDH. The measurements for DJ1 +/+ MEFs were set to one. The LC3-II signal intensity in DJ1 −/− MEFs was compared to DJ1 +/+ MEFs (p-value 0.000676). (D) Although basal autophagy was reduced in DJ1 −/− MEFs, autophagy was not abolished as further shown by transient expression of GFP-LC3 and detecting GFP-LC3 puncta as an indicator for autophagosomes.
Figure 6
Figure 6. Assessing the induction and inhibition of autophagy by WIPI-1 puncta formation analyses in DJ-1 WT and DJ-1 deficient MEF.
GFP-WIPI-1 puncta-formation analyses reveals that forced modulation of the autophagic activity is possible in DJ-1 deficient cells. WT (MEF DJ-1 +/+) (A) or DJ-1 KO MEF (MEF DJ-1 −/−) (B) were treated with standard inducers of autophagy, rapamycin and EBSS (medium lacking amino acids), a standard inhibitor of autophagy, wortmannin, or left untreated (mock treatment, control). Quantitative confocal microscopy was conducted. MEFs that displayed GFP-WIPI-1 puncta were counted as positive (puncta), and MEFs that did not displayed GFP-WIPI-1 were counted as negative (non-puncta). In total 200–300 MEFs were counted from 3 independent experiments (see supplemental figure S2A-H, supplemental table Table S1). P-values for puncta-positive DJ-1 WT cells upon rapamycin ( = 0,00067), wortmannin ( = 0,00026), EBSS ( = 0,00083), and p-values for puncta-positive for DJ-1 definient cells upon rapamycin ( = 0,00111), wortmannin ( = 0,00138), EBSS ( = 0,00117) are indicated (***).
Figure 7
Figure 7. Mitochondrial and lysosomal colocalization.
(A) To analyze mitochondrial and lysosomal colocalization DJ-1 KO and DJ-1 WT MEF were treated with EBSS medium and stained with 200 nM MitoTracker green and 200 nM LysoTracker red for 15 min at 37°C. Pictures were taken by life cell imaging microscope (Cell Observer Z1, Zeiss, Germany) at 37°C using ApoTome® optical slides with 0.35–0.40 z-stacks and colocalization was determined with AxioVision4.7 software (Zeiss, Germany). (B) Statistical evaluation of the scatter-plot analysis of MitoTracker green and LsoTracker red co-staining (AxioVision4.7 software, Zeiss, Germany). The experiment was performed in duplicate analysing a total of 40 cells for each cell line (*p<0.001, Student's t-test). (C) Fibroblasts from carriers of the E64D family and a healthy control were analyzed by live cell imaging using the same protocol for mitochondrial and lysosomal staining as described for MEF cells. Statistical evaluation mitochondria colocalizing with lysosomes compared to total mitochondria. We observed significantly reduced proportion of mitochondria colocalizing with lysosomes in the homozygous mutation carrier compared to healthy control (*p<0.01, Student's t-test). No significant difference was observed between heterozygous carriers and control. The experiment was performed in duplicate analyzing a total more than 30 individual cells for each proband.
Figure 8
Figure 8. Influence of lysosomal degradation of mitochondria on mitochondrial mass and its mechanistic backround.
(A) To analyze mitochondrial mass in DJ-1 KO and DJ-1 WT MEF, cells were treated with 1 µM MitoTracker® green FM (Invitrogen, USA) for 15 min at 37°C. Absorption of MitoTracker® green FM was determined by FACS analysis. The uptake of MitoTracker® was used as an indicator for the mitochondrial mass. We found evidence for increased mitochondrial mass in DJ-1 KO cells compared to controls (*p<0.001, Student's t-test). (B) To further validate our observations on mitochondrial mass, we used an independent method quantifying complex IV subunit I as a mitochondrially encoded protein of the respiratory chain. We found increased protein levels of complex IV subunit I in KO cells compared to controls as indicative of an increased mitochondrial mass in the KO condition. (C) The influence of disturbed lysosomal activity on mitochondrial function was analyzed by measuring the MMP after treatment with BafA1 as an inhibitor of lysosomal function. Cells were treated overnight with 200 nM BafA1 (Calbiochem, Germany) and the integrity of MMP was determined by measuring the uptake of TMRE (Invitrogen, USA) by FACS analysis (CyAnADP, Beckman Coulter). (C) To analyze candidate pathways for DJ-1-mediated modulation of lysosomal degradation we investigated p42/p44 MAPK (ERK1/2) phosphorylation in the mitochondrial (MF) and cytosolic fraction (CF) of DJ-1 WT and DJ-1 KO MEF. Phosphorylation and expression of the ERK1/2 kinase was analyzed by WB using antibodies against phospho-ERK1/2 (Thr202/Tyr204). To define the fractions we used antibodies against prohibitin or GAPDH, as markers for the mitochondrial and the cytosolic fraction, respectively. Quantification of relative protein levels was performed by Image J software. The results indicate a significantly reduced level of phospho-ERK2 in the mitochondrial fraction (p<0.05; Student's t test).

Similar articles

Cited by

References

    1. Schiesling C, Kieper N, Seidel K, Kruger R. Review: Familial Parkinson's disease–genetics, clinical phenotype and neuropathology in relation to the common sporadic form of the disease. Neuropathol Appl Neurobiol. 2008;34:255–271. - PubMed
    1. Valente EM, Abou-Sleiman PM, Caputo V, Muqit MM, Harvey K, et al. Hereditary early-onset Parkinson's disease caused by mutations in PINK1. Science. 2004;304:1158–1160. - PubMed
    1. Strauss KM, Martins LM, Plun-Favreau H, Marx FP, Kautzmann S, et al. Loss of function mutations in the gene encoding Omi/HtrA2 in Parkinson's disease. Hum Mol Genet. 2005;14:2099–2111. - PubMed
    1. Schapira AH. Mitochondrial dysfunction in neurodegenerative diseases. Neurochem Res. 2008;33:2502–2509. - PubMed
    1. Bonifati V, Rizzu P, Squitieri F, Krieger E, Vanacore N, et al. DJ-1(PARK7), a novel gene for autosomal recessive, early onset parkinsonism. Neurol Sci. 2003;24:159–160. - PubMed

Publication types

MeSH terms