

Allele interaction--single locus genetics meets regulatory biology
- PMID: 20186347
- PMCID: PMC2826424
- DOI: 10.1371/journal.pone.0009379
Allele interaction--single locus genetics meets regulatory biology
Abstract
Background: Since the dawn of genetics, additive and dominant gene action in diploids have been defined by comparison of heterozygote and homozygote phenotypes. However, these definitions provide little insight into the underlying intralocus allelic functional dependency and thus cannot serve directly as a mediator between genetics theory and regulatory biology, a link that is sorely needed.
Methodology/principal findings: We provide such a link by distinguishing between positive, negative and zero allele interaction at the genotype level. First, these distinctions disclose that a biallelic locus can display 18 qualitatively different allele interaction sign motifs (triplets of +, - and 0). Second, we show that for a single locus, Mendelian dominance is not related to heterozygote allele interaction alone, but is actually a function of the degrees of allele interaction in all the three genotypes. Third, we demonstrate how the allele interaction in each genotype is directly quantifiable in gene regulatory models, and that there is a unique, one-to-one correspondence between the sign of autoregulatory feedback loops and the sign of the allele interactions.
Conclusion/significance: The concept of allele interaction refines single locus genetics substantially, and it provides a direct link between classical models of gene action and gene regulatory biology. Together with available empirical data, our results indicate that allele interaction can be exploited experimentally to identify and explain intricate intra- and inter-locus feedback relationships in eukaryotes.
Conflict of interest statement
Figures
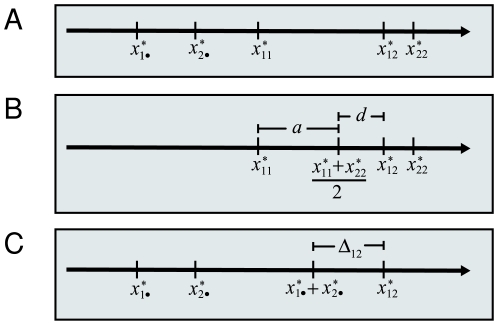
 is defined as half the distance between the two homozygotes while dominance genotypic value
  is defined as the difference between the heterozygote genotypic value and the midpoint between the two homozygote genotypic values. (C) Proposed definition of allele interaction (eqn. (1)). The allele interaction value
  for the heterozygote is defined as the difference between the heterozygote genotypic value and the sum of the two hemizygote genotypic values.
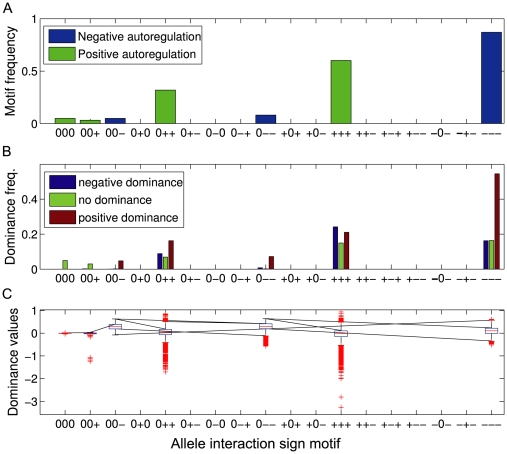
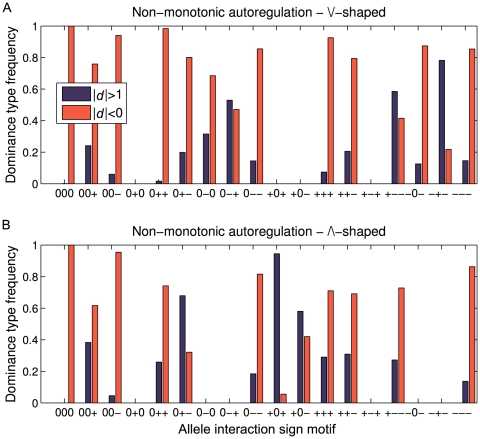
 ) for the various sign motifs. See text for equations and parameter value ranges. 50000 simulations were run for each type of autoregulation, 47186 and 12054 valid datasets are shown for negative and positive autoregulation, respectively.
References
-
- Mendel G. Versuche über Pflanzen-Hybriden. Verhandlungen des naturforschenden Vereines in Brünn. 1865;IV:3–47.
-
- Falconer DS, Mackay TFC. Harlow: Longman Group; 1996. Introduction to quantitative genetics.
-
- Lynch M, Walsh B. Sunderland, Mass.: Sinauer Associates; 1998. Genetics and analysis of quantitative traits.
-
- Gerstein MB, Bruce C, Rozowsky JS, Zheng D, Du J, et al. What is a gene, post-ENCODE? History and updated definition. Genome Research. 2007;17:669–681. - PubMed
-
- Thomas R, D'Ari R. Boca Raton, FL: CRC Press; 1990. Biological feedback.
Publication types
MeSH terms
LinkOut - more resources
Full Text Sources
