. 2010 Mar;63(3):648-57.
doi: 10.1002/mrm.22280.

Improved arterial spin labeling after myocardial infarction in mice using cardiac and respiratory gated look-locker imaging with fuzzy C-means clustering

Affiliations

Improved arterial spin labeling after myocardial infarction in mice using cardiac and respiratory gated look-locker imaging with fuzzy C-means clustering

Moriel H Vandsburger et al. Magn Reson Med. 2010 Mar.

Abstract

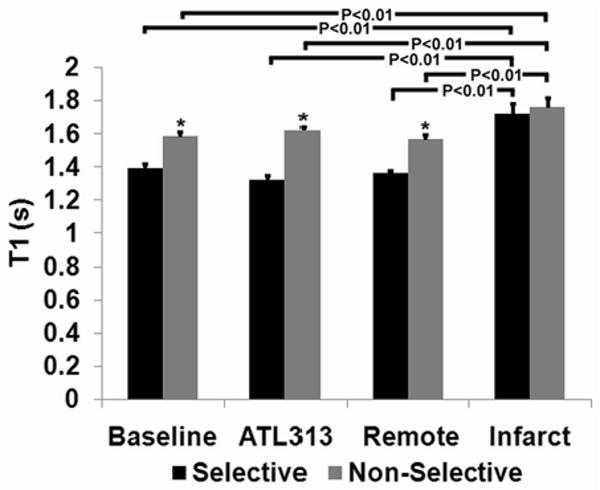
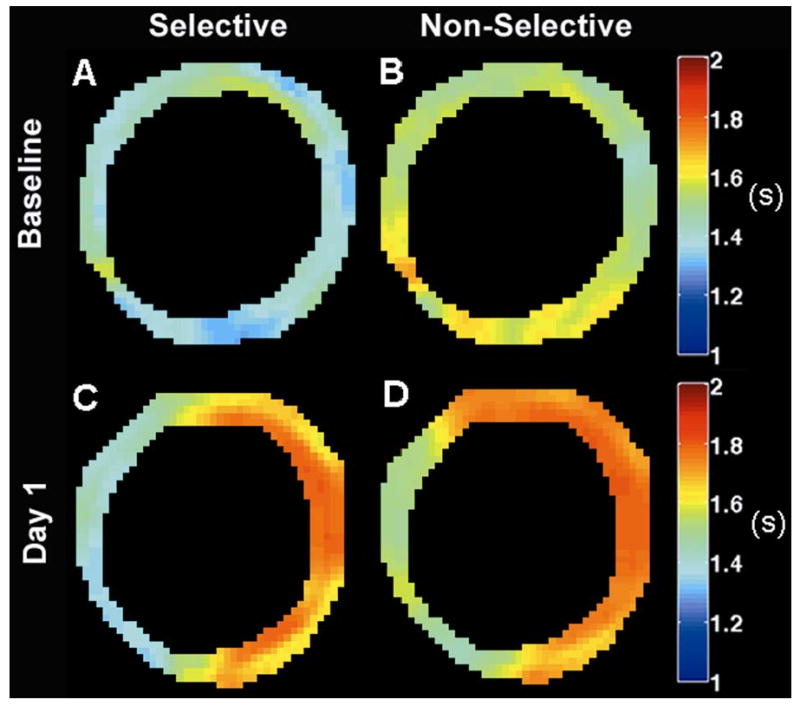
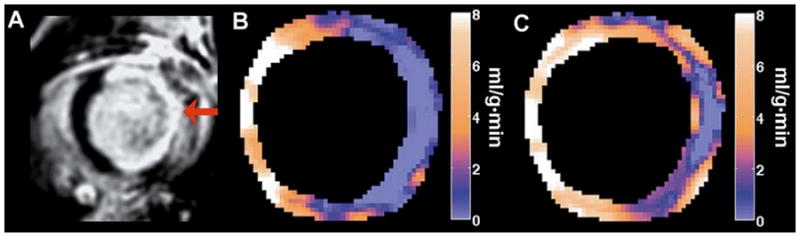
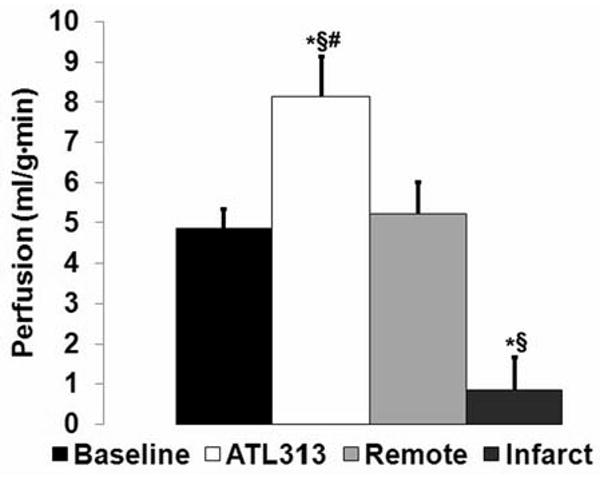
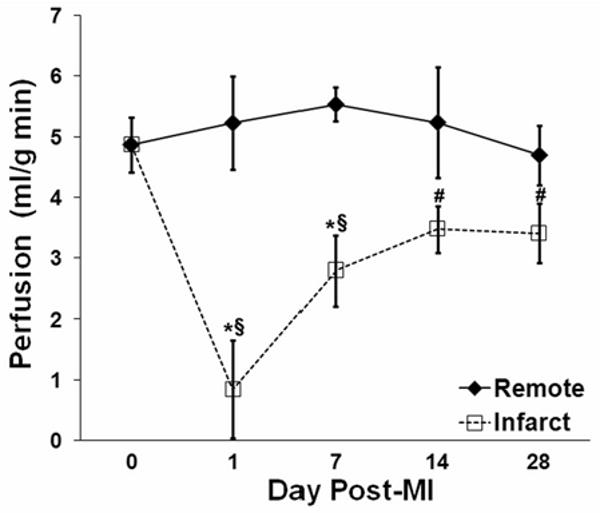
Experimental myocardial infarction (MI) in mice is an important disease model, in part due to the ability to study genetic manipulations. MRI has been used to assess cardiac structural and functional changes after MI in mice, but changes in myocardial perfusion after acute MI have not previously been examined. Arterial spin labeling noninvasively measures perfusion but is sensitive to respiratory motion and heart rate variability and is difficult to apply after acute MI in mice. To account for these factors, a cardiorespiratory-gated arterial spin labeling sequence using a fuzzy C-means algorithm to retrospectively reconstruct images was developed. Using this method, myocardial perfusion was measured in remote and infarcted regions at 1, 7, 14, and 28 days post-MI. Baseline perfusion was 4.9 +/- 0.5 mL/g min and 1 day post-MI decreased to 0.9 +/- 0.8 mL/g min in infarcted myocardium (P < 0.05 versus baseline) while remaining at 5.2 +/- 0.8 mL/g min in remote myocardium. During the subsequent 28 days, perfusion in the remote zone remained unchanged, while a partial recovery of perfusion in the infarct zone was seen. This technique, when applied to genetically engineered mice, will allow for the investigation of the roles of specific genes in myocardial perfusion during infarct healing.


Figures

Figure 1
Figure 1
FAIR Look-Locker CRG-ASL pulse sequence with spiral gradient echo readout. Respiration and ECG were monitored during imaging, and cardio-respiratory triggers (ECG & Resp) were generated during the quiescent phase of expiration (respiratory window). Following the first CRG trigger, a FAIR inversion (dotted box) was applied. The inversion pulse can be either slice selective (solid line for Gz in the FAIR module) or non-selective (dotted line for Gz in the FAIR module). Spiral gradient echoes (solid box) were acquired after every CRG trigger for a period of 5 seconds following magnetization inversion.
Figure 2
Figure 2
Partial histogram of the TIs of the acquired CRG-ASL data. Data were acquired for TIs up to 5000 ms, but only shown up to 2000 ms for figure clarity. The average R-R interval during the scan (prospective interval) was 128 ms (circles), and retrospective TIs were determined with FCM (squares). Retrospective TI calculation by FCM is more accurate than prospective assignment.
Figure 3
Figure 3
Images with slice-selective inversion acquired using CRG-ASL with FCM image reconstruction at baseline (A-E) and one day post-MI (F-J) from the same mouse. Arrows in panels G and H point to remote (black arrow) and infarct (white arrow) regions 1 day after MI. Compared to non-infarcted myocardium, a relative increase in the apparent T1 due to decreased perfusion leads to signal intensity changes in the infarct zone. The uniform intensity of myocardium in panel J indicates that differences seen in panels F-I are due to differences in T1 and not proton density.
Figure 4
Figure 4
Sample T1 relaxation measurements (symbols) and best Bloch equation model fits (lines) for non-selective (NS) and slice-selective (SS) inversions at baseline (A), with ATL313 (B), and in remote (C) and infarcted (D) myocardium 1 day post-MI. The shift between NS and SS T1 relaxation data depends on tissue perfusion. Relative to baseline (A), that shift increases in response to vasodilatation with ATL313 (B), is unchanged in the post-MI remote zone (C), and decreases in infarcted myocardium (D).
Figure 5
Figure 5
Average T1 for NS and SS inversions measured at baseline, with ATL313, and at day 1 in remote and infarcted myocardium (*P < 0.01 vs. selective). At baseline, with ATL313 and for the day 1 remote region, SS T1 is less than NS T1 due to relatively high perfusion. For the day 1 infarct region, SS T1 is not significantly less than NS T1, reflecting the relatively low perfusion in this area. Also, in the day 1 infarct region, both the SS T1 and the NS T1 are high relative to baseline values. This finding likely represents infarct-related edema in this region.
Figure 6
Figure 6
Sample T1 maps from slice-selective and non-selective CRG-ASL scans at baseline (Panels A,B) and one day post-MI (Panels C,D) demonstrate regional changes in T1 relaxation following MI due to both tissue edema and low perfusion in the infarct zone. T1 maps were smoothed using a modified mean crescent filter (36). The filter kernel was 5 pixels wide in the circumferential direction and 2 pixels wide in the radial direction.
Figure 7
Figure 7
Sample perfusion maps generated one day post-MI. (A) Gadolinium-enhanced inversion recovery image displays hyper-enhancement of the infarcted region (arrow). (B) Perfusion map generated using CRG ASL with FCM clustering displays a perfusion defect with close spatial agreement to the infarct region as defined in (A). (C) The perfusion map generated from the same mouse using an ECG-gated acquisition with prospective TI assignment underestimated the region with reduced perfusion.
Figure 8
Figure 8
Measurements of perfusion by CRG-ASL at baseline, with ATL313, and in remote and infarcted myocardium 1 day post-MI (*P < 0.05 vs. baseline, §P < 0.05 vs. day 1 remote, #P < 0.05 vs. day 1 infarct). Myocardial perfusion increased significantly in response to ATL313, and decreased significantly in infarcted myocardium one day post-MI.
Figure 9
Figure 9
Time course of post-infarct myocardial perfusion in infarcted and remote zones. One day after MI, perfusion was very low in the infarct zone and normal in the remote zone. From day 1 to day 14, perfusion in the infarct zone increased and perfusion in the remote zone was unchanged. Symbols designate statistically significant differences (*P < 0.05 vs. remote, §P < 0.05 vs. baseline, #P < 0.05 vs. day 1 post-MI).

Similar articles

Cited by

References

    1. Carmeliet P, Collen D. Transgenic mouse models in angiogenesis and cardiovascular disease. The Journal of Pathology. 2000;190(3):387–405. - PubMed
    1. Balakumar P, Singh AP, Singh M. Rodent models of heart failure. Journal of Pharmacological and Toxicological Methods. 2007;56(1):1. - PubMed
    1. Epstein FH. MR in mouse models of cardiac disease. NMR in Biomedicine. 2007;20(3):238–255. - PubMed
    1. Gilson WD, Epstein FH, Yang Z, Xu Y, Prasad KMR, Toufektsian MC, Laubach VE, French BA. Borderzone Contractile Dysfunction Is Transiently Attenuated and Left Ventricular Structural Remodeling Is Markedly Reduced Following Reperfused Myocardial Infarction in Inducible Nitric Oxide Synthase Knockout Mice. Journal of the American College of Cardiology. 2007;50(18):1799. - PubMed
    1. Ross AJ, Yang Z, Berr SS, Gilson WD, Petersen WC, Oshinski JN, French BA. Serial MRI evaluation of cardiac structure and function in mice after reperfused myocardial infarction. Magnetic Resonance in Medicine. 2002;47(6):1158–1168. - PubMed

Publication types