. 2009 Aug;13(8B):1666-1678.
doi: 10.1111/j.1582-4934.2008.00501.x.

The ubiquitin C-terminal hydrolase UCH-L1 regulates B-cell proliferation and integrin activation

Affiliations

The ubiquitin C-terminal hydrolase UCH-L1 regulates B-cell proliferation and integrin activation

Ulrika Rolén et al. J Cell Mol Med. 2009 Aug.

Abstract

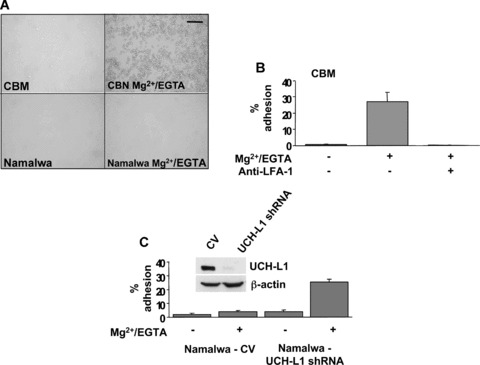
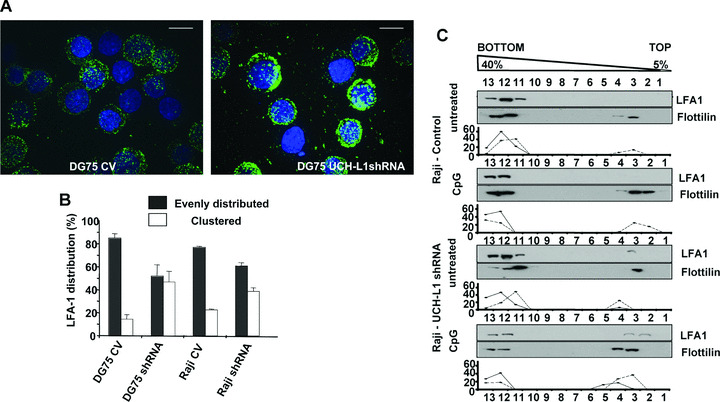
The ubiquitin C-terminal hydrolase-L1 (UCH-L1) is a deubiquitinating enzyme that catalyses the hydrolysis of polyubiquitin precursors and small ubiquitin adducts. UCH-L1 has been detected in a variety of malignant and metastatic tumours but its biological function in these cells is unknown. We have previously shown that UCH-L1 is highly expressed in Burkitt's lymphoma (BL) and is up-regulated upon infection of B lymphocytes with Epstein-Barr virus (EBV). Here we show that knockdown of UCH-L1 by RNAi inhibits the proliferation of BL cells in suspension and semisolid agar and activates strong LFA-1-dependent homotypic adhesion. Induction of cell adhesion correlated with cation-induced binding to ICAM-1, clustering of LFA-1 into lipid rafts and constitutive activation of the Rap1 and Rac1 GTPases. Expression of a catalytically active UCH-L1 promoted the proliferation of a UCH-L1-negative EBV transformed lymphoblastoid cell line (LCL) and inhibited cell adhesion, whereas a catalytic mutant had no effect, confirming the requirement of UCH-L1 enzymatic activity for the regulation of these phenotypes. Our results identify UCH-L1 as a new player in the signalling pathways that promote the proliferation and invasive capacity of malignant B cells.


Figures

Figure 1
Figure 1
UCH‐L1 expression promotes the proliferation of BL cells in suspension and semisolid agar. (A) Representative Western blots illustrating the expression of UCH‐L1 in untreated BL cells and BL cell transduced with a control lentivirus or a lentivirus expressing a specific UCH‐L1 shRNA. Total cell lysates were fractionated by SDS‐PAGE and the blots were probed with a UCH‐L1‐specific antibody. More than 90% reduction of the UCH‐L1‐specific band was regularly observed in the shRNA expressing cells. (B) Representative growth curves of control virus and UCH‐L1 shRNA transduced BL cells. The cells were seeded at a concentration of 2 × 10⁵/ml and number of viable cells was counted every other day by tripan blue dye exclusion. After 6 days, the cells were reseeded at the original cell concentration. The values represent the mean of three or more experiments performed with each cell line. (C) UCH‐L1 knockdown results in a 5‐ to 20‐fold decrease in the number of cells capable of forming colonies in semisolid agar. The mean percentage colony forming cells in three independent experiments performed with each cell line is shown in the figure. *P < 0.01 compared with uninfected and control virus infected cells. (D) UCH‐L1 knockdown is associated with increased levels of p27Kip1. Representative Western blots illustrating the expression of p27Kip1 p21 and c‐Myc in untreated (Parental), control virus (CV) and UCH‐L1 shRNA transduced cells. β‐actin served as a loading control. One representative experiment out of three performed with each combination of cell lines is shown in the figure.
Figure 2
Figure 2
UCH‐L1 expression modulates LFA‐1‐dependent homotypic adhesion. (A) Representative micrographs illustrating the growth pattern of BL cells transduced with control or UCH‐L1‐shRNA lentiviruses. UCH‐L1 knockdown was associated with a dramatic increase in the capacity of BL cells to form large cell clusters, whereas cells transduced with the control virus did not differ significantly from the uninfected controls (not shown). Scale bar 100 μm. (B) The increased homotypic adhesion induced by UCH‐L1 knockdown is dependent on LFA‐1. Cell transduced with the UCH‐L1 shRNA lentivirus were incubated in the present of an LFA‐1‐specific antibody (lower panel). An irrelevant antibody of the same isotype was used as control (top panel). One representative experiment out of three is shown. (C) UCH‐L1 does not affect the expression levels of LFA‐1. Representative Western blot illustrating the expression of the αL chain of LFA‐1 in the BL lines DG45 and Raji and in cells transduced with control or UCH‐L1 shRNA lentiviruses. β‐actin served as a loading control. (D) UCH‐L1 does not affect the accumulation of LFA‐1 αL/β2 heterodimers at the cell surface. Representative FACS plots illustrating the surface expression of LFA‐1 as detected by immunofluorescence staining with an LFA‐1 αL‐specific antibody. The mean fluorescence intensity is indicated in each plot. One representative experiment out of at least three performed with each pair of control and UCH‐L1 shRNA transduced cells is shown in the figure.
Figure 3
Figure 3
UCH‐L1 regulates the affinity of LFA‐1 for its ligand ICAM‐1. (A) Treatment with Mg2+/EGTA induces binding of LCL cells to Fc‐ICAM‐1‐coated plates (top panel) but does not affect the binding of BL cells (bottom panel). (B) The adhesion of CBM cell to Fc‐ICAM‐1‐coated plates is dependent on LFA‐1. Radioactively labelled CBM cells were incubated for 1 hr at 37°C in triplicate wells of Fc‐ICAM‐1‐coated 96‐well plates in the presence or absence of Mg2+/EGTA. Cells firmly adherent to the plates were then lysed and the readiocativity was measured in a γ‐counter. Where indicated, the cells were preincubated with LFA‐1‐specific or control antibodies for 30 min. at room temperature. Mean ± S.D. of specific binding in three independent experiments. (C) UCH‐L1 knockdown promotes the binding of BL cells to ICAM‐1‐coated plates. Binding of control and UCH‐L1 shRNA transduced Namalwa to Fc‐ICAM‐1‐coated plates in the presence or absence of Mg2+/EGTA. Mean ± S.D. of three independent experiments. UCH‐L1 knockdown was confirmed in Western blots probed with an UCH‐L1‐specific antibody (insert).
Figure 4
Figure 4
UCH‐L1 regulates the distribution of LFA‐1 in the cell membrane. (A) Representative immunofluorescence micrographs illustrating the surface distribution of LFA‐1 in BL cells transduced with control or UCH‐L1 shRNA lentiviruses. The cells were stained with an antibody specific to the αL chain of LFA‐1 and the nuclei were stained with DAPI. (B) Analysis of LFA‐1 membrane distribution in BL cells transduced with control UCH‐L1 shRNA lentiviruses. The membrane distribution of LFA‐1 was visually assessed in at least 100 cells per each slide. Mean ± S.D. of at least three experiments performed with each pair of cell lines. (C) UCH‐L1 knockdown results in spontaneous relocalization of LFA‐1 to lipid rafts. The distribution of LFA‐1 was examined by sucrose gradient flotation assays in untreated and CpG DNA treated Raji cells transduced with control or UCH‐L1 shRNA lentiviruses. LFA‐1 was detected by probing Western blots of each fraction with αL chain‐specific antibodies. Flotillin was used as a marker for lipid rafts. The percentage of Flotillin and LFA‐1 recovered in each fraction is plotted below each blot. One representative experiment out of three is shown in the figure.
Figure 5
Figure 5
UCH‐L1 knockdown leads to constitutive activation of Ras family GTPases. (A) The endogenous levels of activated Rac1 and Rap1 are increased upon UCH‐L1 knockdown. Activated Rac1GTP and Rap1GTP were affinity purified using as baits GST‐PBD and GST‐RalGDS, respectively, and Western blots of equal amounts of total and purified cell lysates were probed with Rac1‐ and Rap1‐specific antibodies. HeLa cells treated with CNF served as control for Rac1 activation. One representative experiment, where DG75 and Namalwa cells transduced with control and UCH‐L1 shRNA lentiviruses were tested in parallel, is shown in the figure. (B) Quantification of the Rac1GTP and Rap1GTP levels in a panel of BL lines. The percentage of Rac1GTP and Rap1GTP were calculated relative to the total input and the fold induction was calculated as the ratio between as the percentage Rac1GTP and Rap1GTP in UCH‐L1 knockdown versus control virus transduced cells. Mean ± S.D. of three to six experiments performed with each cell pair.
Figure 6
Figure 6
The enzymatic activity of UCH‐L1 is required for its effect on B‐cell proliferation and homotypic adhesion. (A) Expression and activity of UCH‐L1 and catalytically inactive UCH‐L1 C90S mutant in stably transfected CBM cells. UCH‐L1 expression was detected in Western blots probed with a UCH‐L1‐specific antibody (lower panel). The enzymatic activity was assessed by labelling the cell lysates with the HA‐Ub‐VME functional probe followed by detection of the labelled DUBs with antibodies specific for the HA tag (upper panel). Identification of the labelled DUBs was done based on the molecular mass of the polypeptides and previous characterization by mass spectrometry. (B) Expression of a catalytically active UCH‐L1 enhances the proliferation capacity of CBM cells. Representative growth curves of CBM parental cells and CBM cells transfected with the wild‐type UCH‐L1 or the UCH‐L1 C90S catalytic mutant. The growth curves were performed as described in the legend to Fig. 1. One representative experiment out of three is shown in the figure. (C) Stable expression of a catalytically active UCH‐L1 decreased the homotypic adhesion in CBM cells, whereas the UCH‐L1‐C90S had no effect. Pictures of cells cultured overnight at a concentration of 5 × 10⁵/ml in serum‐free medium were taken with an inverted light microscope equipped with a cooled CCD camera using 10× and 4× objectives.
Figure 7
Figure 7
UCH‐L1 inhibits the activation and membrane relocalization of LFA‐1 in LCL cells. (A) Expression of UCH‐L1 inhibits the Mg2+/EDTA‐induced binding of CBM cells to Fc‐ICAM‐1‐coated plates. The percentage of CBM and CBM‐UCH‐L1 cells bound to Fc‐ICAM‐1‐coated plates in the presence or absence of Mg2+/EGTA is shown in the figure. Mean ± S.D. of three experiments. The expression of UCH‐L1 was confirmed by Western blot (insert). (B) Expression of UCH‐L1 expression prevents the clustering of LFA‐1. Representative immunofluorescence micrographs illustrating the distribution of LFA‐1 in the cell membrane of control and UCH‐L1‐transfected CBM cells. The cells were stained with an antibody specific to the αL subunit of LFA‐1 and the nuclei were stained with DAPI. (C) LFA‐1 membrane distribution in vector and UCH‐L1‐transfected CBM cells. The membrane distribution of LFA‐1 was visually assessed in at least 100 cells per each slide. Mean ± S.D. of three experiments where the cell lines were tested in parallel. (D) Representative experiment illustrating the decrease of endogenous levels of Rap1GTP in UCH‐L1‐transfected cells. Rap1GTP was pooled down from equal amount of cell lysates using GST‐RalGDS and Western blots were probed with an anti‐Rap1 antibody.

Similar articles

Cited by

References

    1. Ciechanover A, Schwartz AL. The ubiquitin system: pathogenesis of human diseases and drug targeting. Biochim Biophys Acta . 2004; 1695: 3–17. - PubMed
    1. Love KR, Catic A, Schlieker C, et al. Mechanisms, biology and inhibitors of deubiquitinating enzymes. Nat Chem Biol . 2007; 3: 697–705. - PubMed
    1. Nijman SM, Luna‐Vargas MP, Velds A, et al. A genomic and functional inventory of deubiquitinating enzymes. Cell . 2005; 123: 773–86. - PubMed
    1. Brady G, MacArthur GJ, Farrell PJ. Epstein‐Barr virus and Burkitt lymphoma. J Clin Pathol . 2007; 60: 1397–402. - PMC - PubMed
    1. Masucci MG. Epstein‐Barr virus oncogenesis and the ubiquitin‐proteasome system. Oncogene . 2004; 23: 2107–15. - PubMed

Publication types