. 2009 Aug;13(8B):1792-1808.
doi: 10.1111/j.1582-4934.2008.00607.x.

Developmental tumourigenesis: NCAM as a putative marker for the malignant renal stem/progenitor cell population

Affiliations

Developmental tumourigenesis: NCAM as a putative marker for the malignant renal stem/progenitor cell population

Naomi Pode-Shakked et al. J Cell Mol Med. 2009 Aug.

Abstract

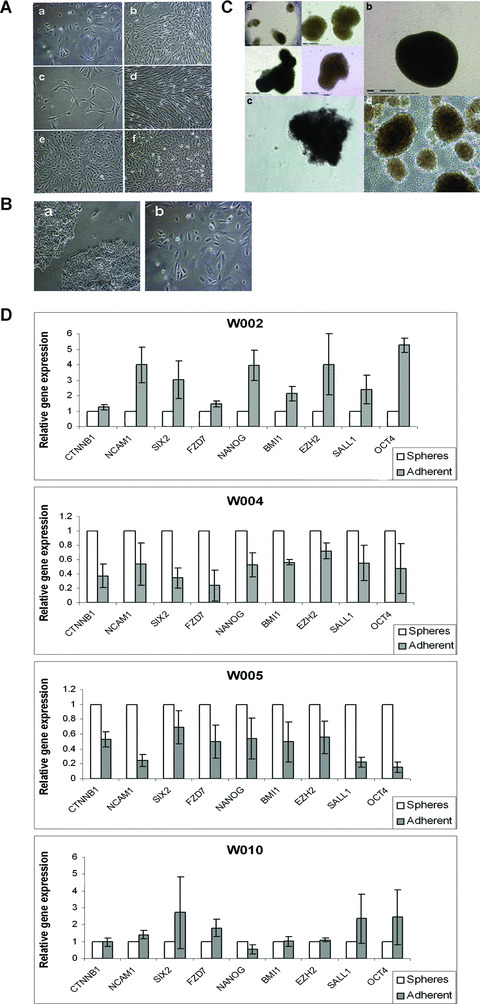
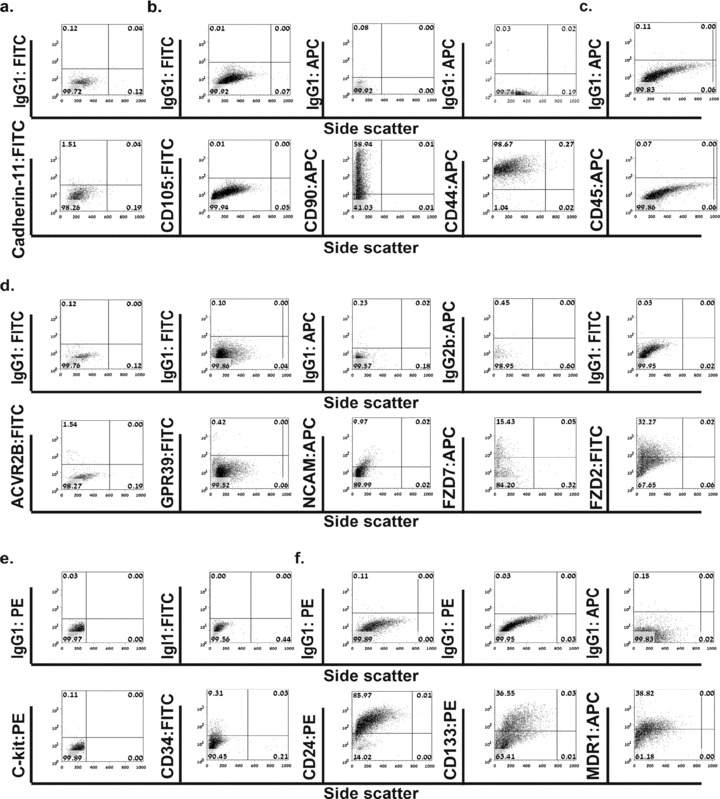
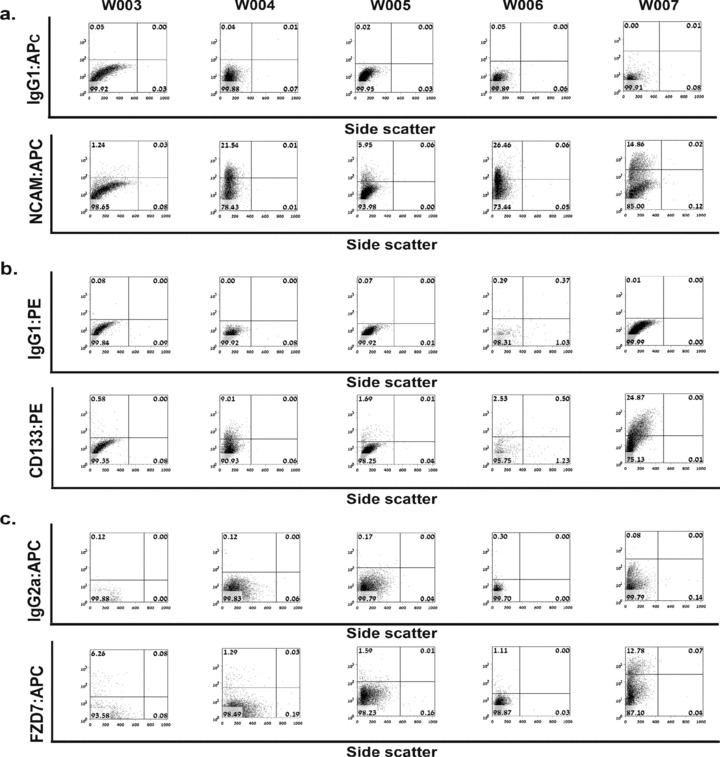
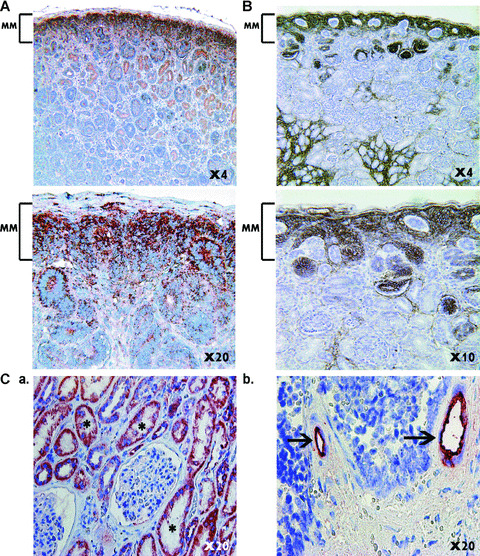
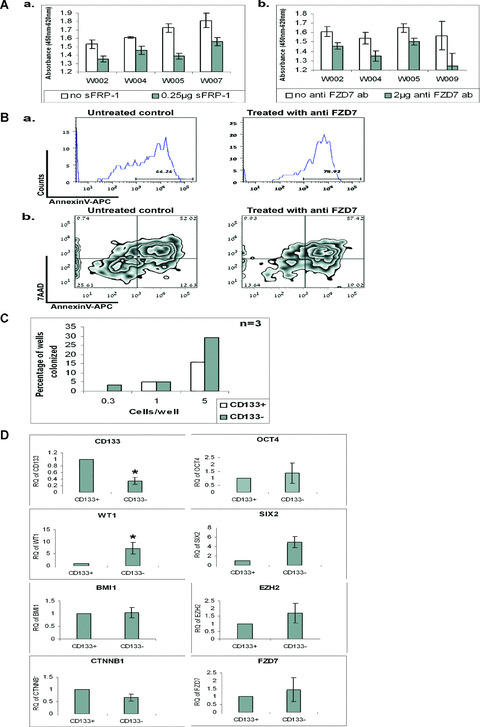
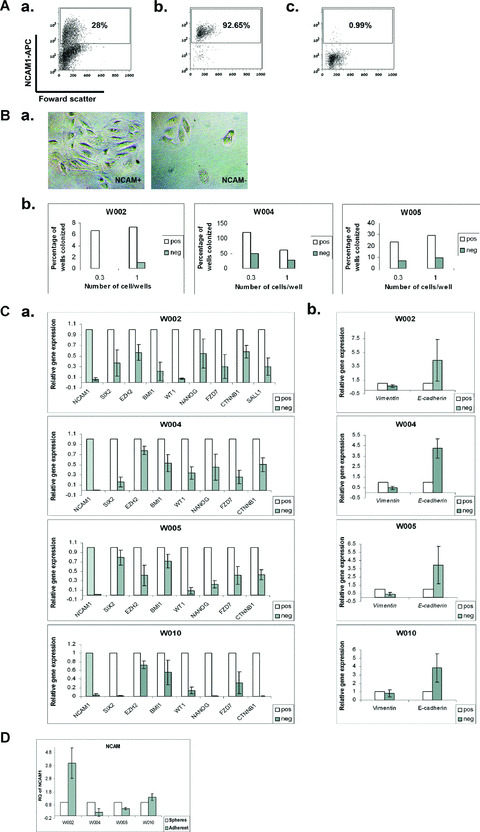
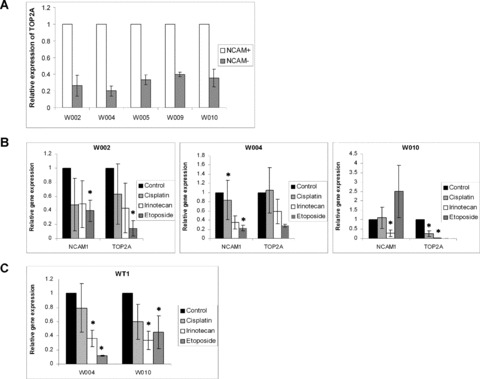
During development, renal stem cells reside in the nephrogenic blastema. Wilms' tumour (WT), a common childhood malignancy, is suggested to arise from the nephrogenic blastema that undergoes partial differentiation and as such is an attractive model to study renal stem cells leading to cancer initiation and maintenance. Previously we have made use of blastema-enriched WT stem-like xenografts propagated in vivo to define a 'WT-stem' signature set, which includes cell surface markers convenient for cell isolation (frizzled homolog 2 [Drosophila] - FZD2, FZD7, G-protein coupled receptor 39, activin receptor type 2B, neural cell adhesion molecule - NCAM). We show by fluorescenceactivated cell sorting analysis of sphere-forming heterogeneous primary WT cultures that most of these markers and other stem cell surface antigens (haematopoietic, CD133, CD34, c-Kit; mesenchymal, CD105, CD90, CD44; cancer, CD133, MDR1; hESC, CD24 and putative renal, cadherin 11), are expressed in WT cell sub-populations in varying levels. Of all markers, NCAM, CD133 and FZD7 were constantly detected in low-to-moderate portions likely to contain the stem cell fraction. Sorting according to FZD7 resulted in extensive cell death, while sorted NCAM and CD133 cell fractions were subjected to clonogenicity assays and quantitative RT-PCR analysis, exclusively demonstrating the NCAM fraction as highly clonogenic, overexpressing the WT 'stemness' genes and topoisomerase2A (TOP2A), a bad prognostic marker for WT. Moreover, treatment of WT cells with the topoisomerase inhibitors, Etoposide and Irinotecan resulted in down-regulation of TOP2A along with NCAM and WT1. Thus, we suggest NCAM as a marker for the WT progenitor cell population. These findings provide novel insights into the cellular hierarchy of WT, having possible implications for future therapeutic options.


Figures

Figure 1
Figure 1
Primary Wilms’ tumour (WT) cell cultures. (A) Pictures by confocal microscope of six primary WTs in culture, showing mostly mesenchymal cell morphology. (magnification ×10); (B) Morphologic plasticity of cells from the same primary WT (WOO2) after an equal number of passages, showing different morphologic cell structures in culture – (a) – cobblestone shaped cells, (b) – spindle shaped cells. (magnification ×10); (C) Primary WTs of different histologic subtypes form sphere‐like clusters in low attachment conditions. Photomicrographs of cultured WT cells (magnification ×20) at 5 days after plating the cells in ultra‐low attachment plates with medium suitable for growing embryoid bodies from hESC [30]; (i) WOO2, (ii) WOO3, (iii), WOO4 and (iv) WOO5; (magnification ×20). (D) Quantitative RT‐PCR analysis for the expression of WT‐stem signature (nephric‐progenitor‐ WT1, SIX2, Sall1, polycomb group‐ EZH2, BMI1, Wnt pathway‐FZD7, β‐catenin and ESC – nanog, Oct4) genes in WT cells grown in adherence promoting conditions (open bars) in comparison to WT spheres (grey bars). Shown are experiments in cells derived from four different WTs (WOO2, WOO4, WOO5 and WO1O). The value for the spheres was used as the calibrator (therefore =1) and all other values were calculated with respect to it. Results are presented as the mean ± S.E.M of at least three separated experiments. Quantitative transcript levels were normalized to expression of β‐actin or GAPDH.
Figure 2
Figure 2
Flow cytometric analyses of primary Wilms’ tumours. A representative FACS analysis for each marker of the various groups: (A) Blastemal markers, (B) Mesenchymal stem cell markers, (C) Pan haematopoietic marker, (D) Markers that were overexpressed in stem‐like WT xenografts (E) haematopoietic stem cell markers, (F) Markers of cancer and normal stem cells in other tissues, demonstrates the expression of Cadherin‐11, CD133, NCAM, GPR39, ACVRIIB, FZD7, FZD2, CD34, CD90, CD44 in WT cell sub‐populations and the absence of CD105, C‐kit, and CD45 expression. Data are representative of no less than two separate experiments for each marker in at least five tumours.
Figure 3
Figure 3
Flow cytometric analyses of NCAM, FZD7 and CD133 expression in primary Wilms’ tumours. Detailed analysis of (A) NCAM, (B) FZD7 and (C) CD133 in five additional tumours (WOO3, WOO4, WOO5, WOO6, WOO7) and corresponding isotype controls showing low‐moderate expression in all tumours examined. Upper panels represent isotype control antibody analysis of the corresponding stained cells in bottom panels.
Figure 4
Figure 4
In situ localization of FZD7, NCAM and CD133. (A, B) Immunostaining of mid‐gestation human foetal kidney demonstrates expression of (A) Frizzled7 (original magnification: upper left panel ×4, lower left panel ×20) and (B) NCAM (original magnification: upper right panel ×4, lower right panel ×10) in the nephrogenic mesenchyme (MM). (C) Staining of human adult kidney (a) and WT (b) for CD133 demonstrates expression in renal tubular epithelia (C, a – asterix) and in tumour vasculature (C, b – arrows) – (original magnification: ×40); Cells were counterstained with haematoxylin and eosin.
Figure 5
Figure 5
Exclusion of FZD7 and CD133 as markers for the isolation of WT stem/progenitor cells. (A) Cell viability was determined by XTT cell proliferation assay (black bars, WT cells treated with either sFRP1 or anti‐FZD7 antibody; white bars, untreated WT cells), which measures mitochondrial respiratory function as described in materials and methods, on four WT cultures derived from four different tumours in the absence or presence of either (A) the Wnt signalling antagonist at the frizzled receptor level – secreted frizzled‐related protein 1 (sFRP1) or (B) anti‐FZD7 antibody showing decreased survival rate in all preparations by either compound in comparison to untreated controls. Data are means ± S.E.M derived from two independent experiments with triplicate wells per condition, P < 0.05; (B) Enhanced WT Cell death after exposure to 5 μg of anti FZD7 antibody for 12 hrs. (a) Flow cytometric analysis of WT cells incubated overnight with (treated) or without (untreated) anti‐FZD7 antibody. Cell number is plotted as a function of the intensity of staining for annexin V; cells stained positive with annexin V antibodies are apoptotic. The percentages of apoptotic cells are indicated. (b) Flow cytometry profile represents annexin‐V‐APC staining in x axis and 7AAD in y axis. Shown is a marked elevation in the early apoptotic (annexin V+ 7AAD) and a substantial reduction in the surviving (annexin V 7AAD) WT cells after treatment with anti‐FZD7 antibody, in comparison to untreated control. Data presented are representative of three independent experiments. (C) Clonogenicity assays of the sorted CD133+ and CD133 WT sub‐populations performed on three different WTs. Columns represent the mean number of colonized wells. Limiting dilutions followed by plating of a single cell/well in 96‐well plates were performed in order to compare the clonogenic capabilities between WT CD133+ and CD133 cell fractions. No significant difference in clonogenic capacity was observed between the two cell fractions; (D) Quantitative RT‐PCR analysis of the WT‐stem signature genes (nephric‐progenitor‐ WT1, SIX2, polycomb group‐ EZH2, BMI1, Wnt pathway‐FZD7, β‐catenin and self‐renewal/multipoteniality‐ OCT4) in CD133+ and CD133 WT sorted cells from at least three different tumours, demonstrates no difference between the cell fractions or higher expression in the CD133 in comparison to the CD133+ sub‐population. The value for the CD133+ was used as the calibrator (therefore = 1) and all other values were calculated with respect to it. Results are the mean ± S.E.M of four separate experiments, *P < 0.05. Quantitative transcript levels were normalized to expression of β‐actin.
Figure 6
Figure 6
Functional analysis of sorted NCAM+ and NCAM WT sub‐populations. (A) Sorting experiments of WTs according to NCAM expression. Seen are (a) Primary WT cells prior to sorting, and after sorting (b) a highly enriched positive cell fraction (>92%) and (c) a highly pure negative fraction (<2%). (B) Clonogenic capacity of the NCAM+ versus the NCAM WT cells. Shown are representative experiments performed on three WTs obtained from three different donors, demonstrating the NCAM+ to be highly clonogenic compared to the NCAM WT cells. (C) Quantitative RT‐PCR analysis of the WT‐stem signature genes (WT1, SIX2, EZH2, BMI1, FZD7, β‐catenin and nanog) and renal differentiation associated genes (Vimentin and E‐cadherin) in NCAM+ and NCAM WT sub‐populations demonstrates (C, a) elevated mRNA levels of the ‘tumour‐progenitor’ genes in the NCAM+ cell fraction compared to the negative one; (C, b) elevated Vimentin mRNA levels and low E‐cadherin. Experiments were performed on four WTs derived from four different donors. The value for the NCAM+ was used as the calibrator (therefore =1) and all other values were calculated with respect to it. Results are presented as the mean ± S.E.M of at least three separate experiments. P < 0.05 for elevation of all the WT‐stem signature genes in the NCAM+ relative to the NCAM WT cells. (D) Quantitative RT‐PCR analysis of NCAM mRNA levels along with that of the WT‐stem signature and stemness genes in WT spheres and adherent cultures. NCAM expression in WT cells follows the expression pattern of the stenmess genes, shown in Fig. 1D, regardless of the culturing method employed. Experiments were performed on four WTs derived from four different donors. For each tumour experiments were repeated at least three times. The value for the spheres was used as the calibrator (therefore=1) and all other values were calculated with respect to it. Results are presented as the mean ± S.E.M of three separate experiments. Quantitative transcript levels were normalized to expression of β‐actin or GAPDH.
Figure 7
Figure 7
TOP2A is overexpresed by NCAM+ WT cells. (A) Quantitative RT‐PCR analysis for the expression of TOP2A in the NCAM+ in comparison to the NCAM WT cells. The NCAM+ cells consistently overexpressed the WT poor prognostic factor, TOP2A. Shown are experiments performed on five different WTs. The value for the NCAM+ was used as the calibrator (therefore =1) and all other values were calculated with respect to it. Results are presented as the mean ± S.E.M of at least three separate experiments. P < 0.05. (B) Reduction in TOP2A expression as a result of treatment with the topoisomerase inhibitors, either Etoposide or Irinotecan, mostly correlates with reduction of NCAM expressions in WT cells in comparison to untreated control. Shown are experiments performed on three different WTs. (C) Treatment of WT cells with either of the topoisomerase inhibitors reduces the expression of the WT1 gene in comparison to untreated control. Shown are experiments performed on two different WTs. The value for the untreated control was used as the calibrator (therefore =1) and all other values were calculated with respect to it. Results are presented as the mean ± S.E.M of at least three separate experiments for each of the tumours, *P < 0.05. Quantitative transcript levels were normalized to expression of either β‐actin or GAPDH.

Similar articles

Cited by

References

    1. Rivera MN, Haber DA. Wilms’ tumour: connecting tumorigenesis and organ development in the kidney. Nat Rev Cancer. 2005; 5: 699–712. - PubMed
    1. Feinberg AP, Williams BR. Wilms’ tumor as a model for cancer biology. Methods Mol Biol. 2003; 222: 239–48. - PubMed
    1. Dekel B, Metsuyanim S, Schmidt‐Ott KM, et al . Multiple imprinted and stemness genes provide a link between normal and tumor progenitor cells of the developing human kidney. Cancer Res. 2006; 66: 6040–9. - PubMed
    1. Li CM, Guo M, Borczuk A, et al . Gene expression in Wilms’ tumor mimics the earliest committed stage in the metanephric mesenchymal‐epithelial transition. Am J Pathol. 2002; 160: 2181–90. - PMC - PubMed
    1. Natrajan R, Reis‐Filho JS, Little SE, et al . Blastemal expression of type I insulin‐like growth factor receptor in Wilms’ tumors is driven by increased copy number and correlates with relapse. Cancer Res. 2006; 66: 11148–55. - PubMed

Publication types

MeSH terms

Substances