. 2010 Mar 15;23(3):696-704.
doi: 10.1021/tx9004506.

3-Methylindole metabolites induce lung CYP1A1 and CYP2F1 enzymes by AhR and non-AhR mechanisms, respectively

Affiliations

3-Methylindole metabolites induce lung CYP1A1 and CYP2F1 enzymes by AhR and non-AhR mechanisms, respectively

Jessica M Weems et al. Chem Res Toxicol. .

Abstract

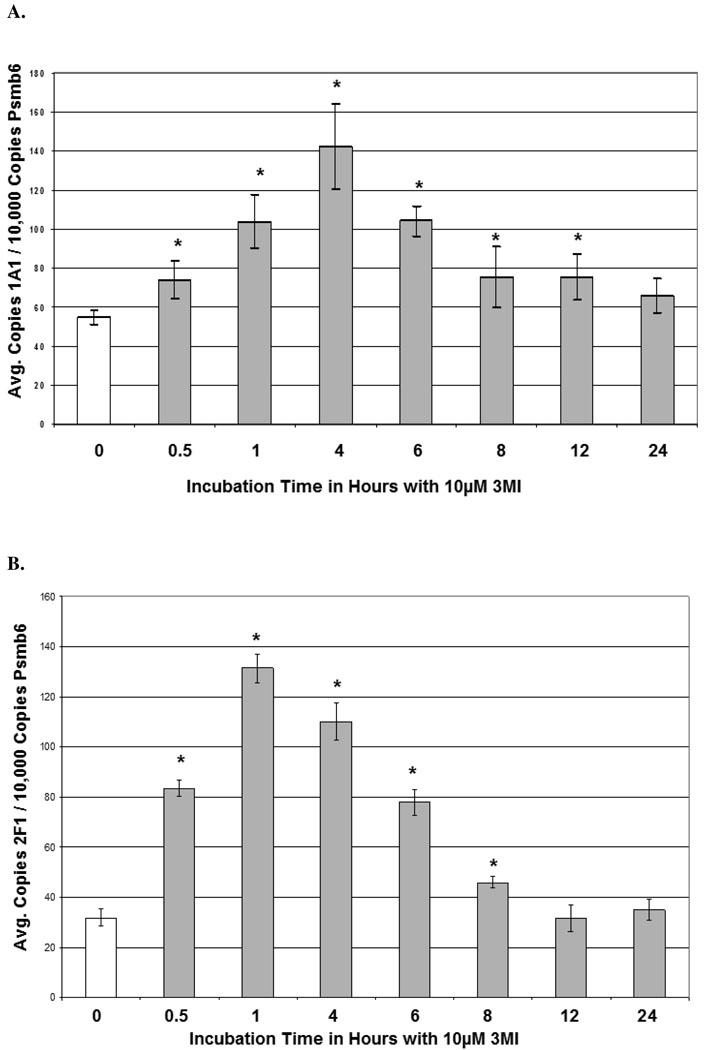
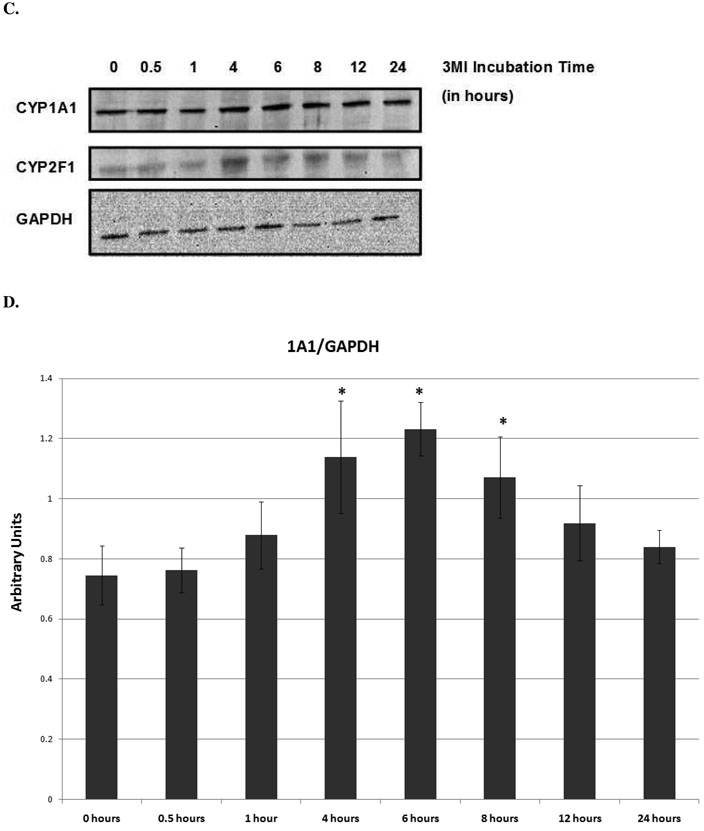
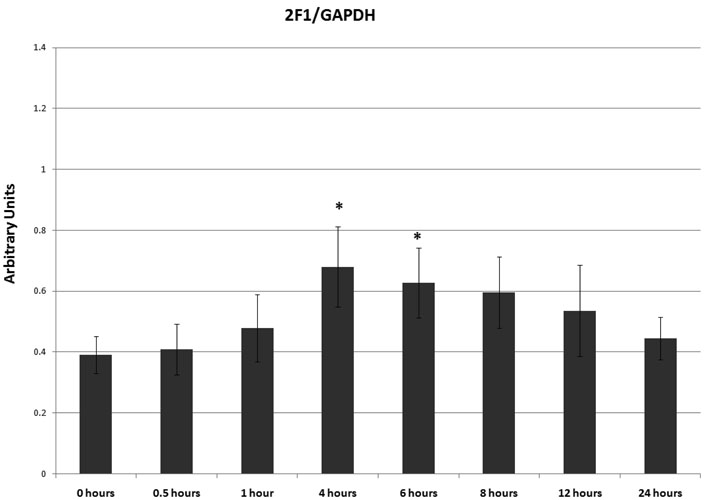
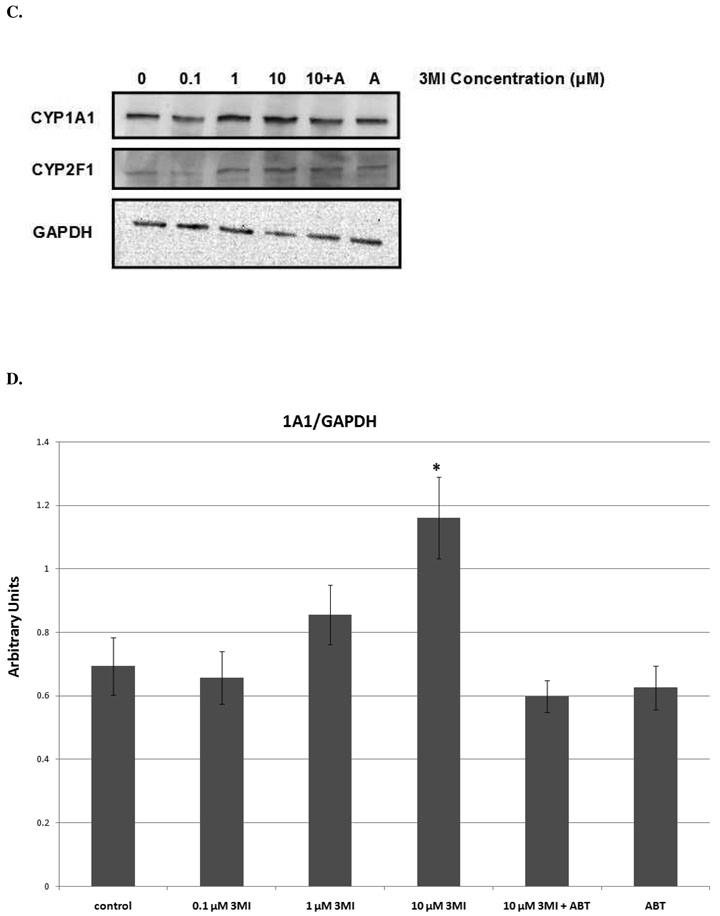
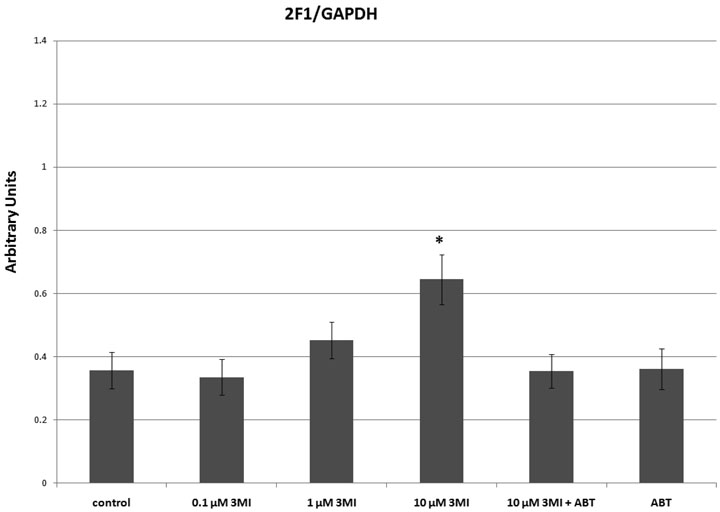
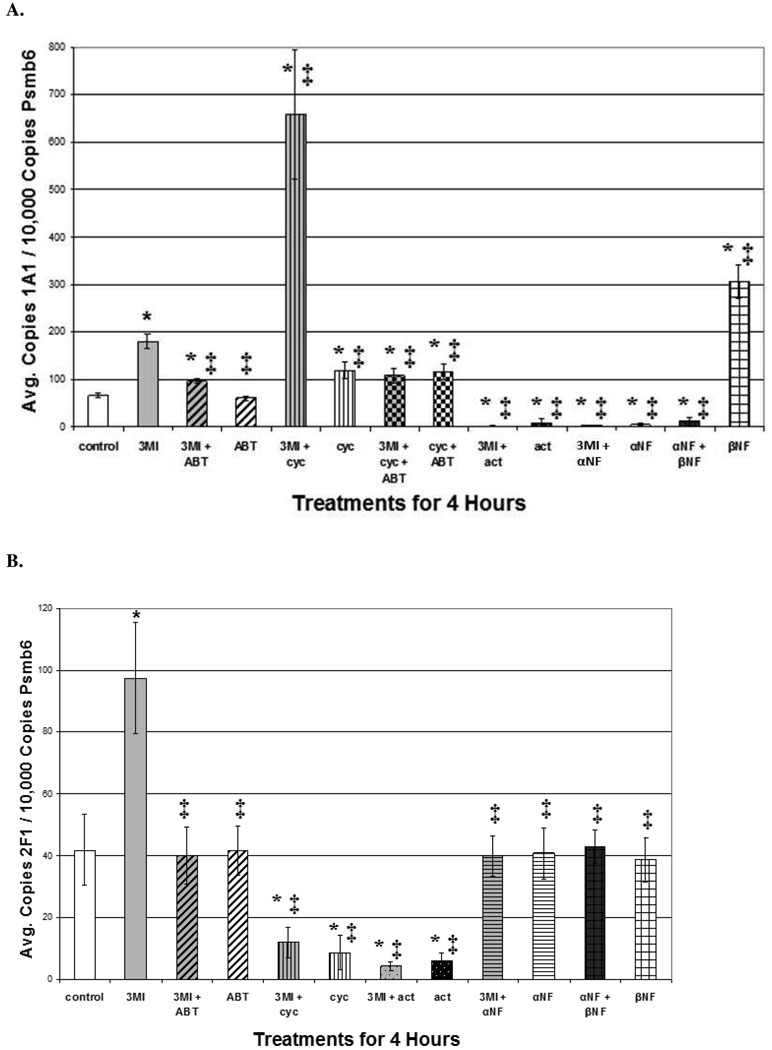
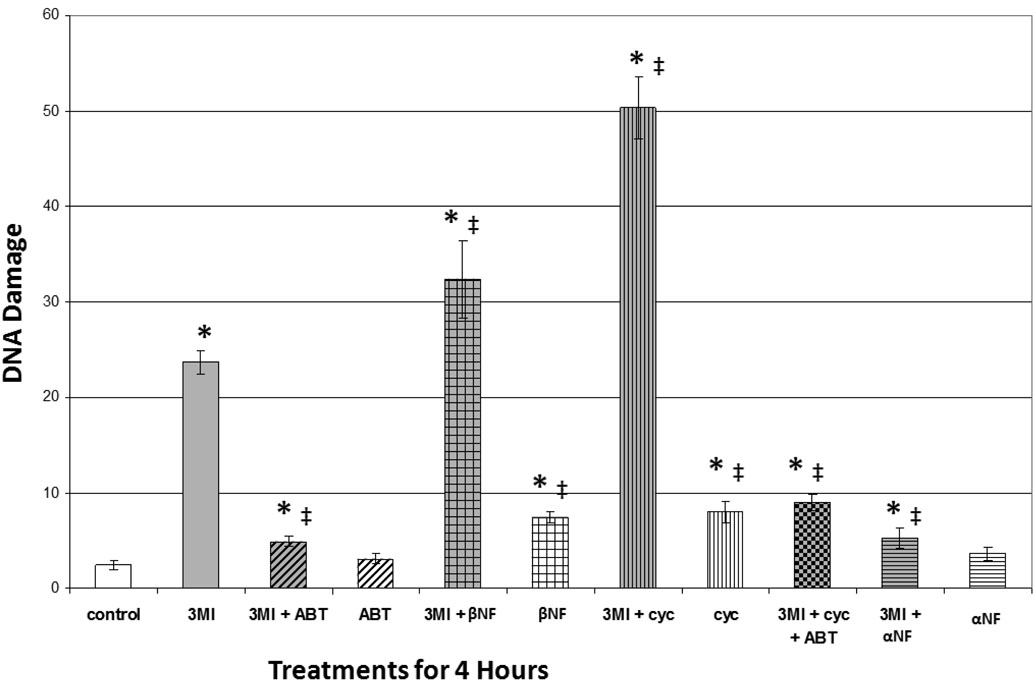
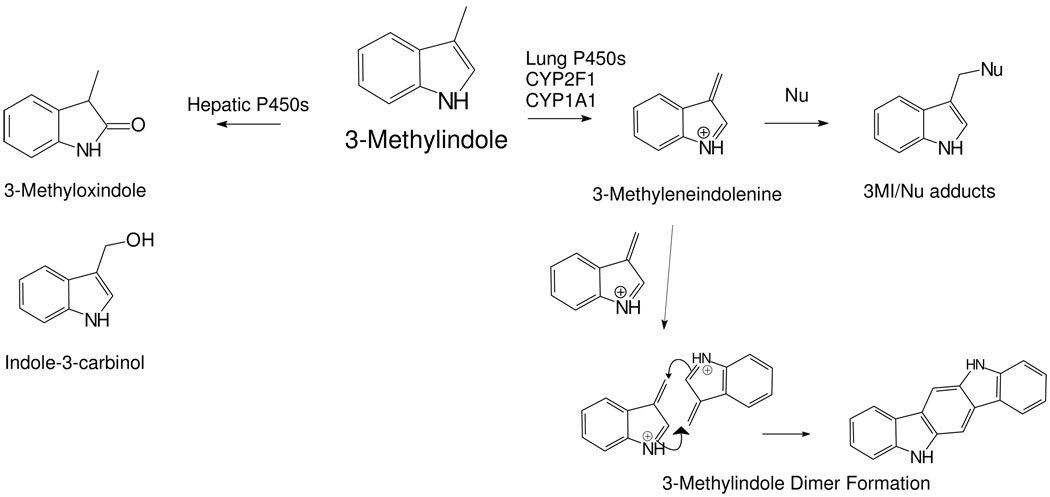
3-Methylindole (3MI) is a highly selective pneumotoxicant that is present in abundant amounts (as high as 1.4 mug/cigarette) in cigarette smoke. Several human cytochrome P450 enzymes that are expressed in lung, such as CYP1A1, CYP2F1, CYP2A13, and CYP4B1, catalyze the dehydrogenation of 3MI to the reactive intermediate 3-methyleneindolenine, which alkylates DNA and induces cell death through apoptosis. In addition, 3MI potently damages DNA at low concentrations (observable at 0.1 muM). However, it seemed possible that 3MI could induce the levels of P450 enzymes, so transcription and translation of 1A1 and 2F1 genes were measured in primary normal human bronchial epithelial cells. In this study, 3MI-induced DNA damage at the 10 muM concentration was ameliorated when P450 turnover was inactivated with the cytochrome P450 suicide substrate inhibitor 1-aminobenzotriazole. Thus, the observed DNA damage was cytochrome P450-dependent. Quantitative real-time polymerase chain reaction analysis revealed both concentration- and time-dependent increases in CYP1A1 and CYP2F1 transcription by the same 3MI concentrations that damaged DNA. Aryl hydrocarbon receptor (AhR) activation lead to CYP1A1 induction. Treatment with 3MI in combination with the AhR antagonist alpha-naphthoflavone prevented 3MI-mediated CYP1A1 induction, indicating that the induction was AhR-dependent. Conversely, CYP2F1 induction did not appear to require activation of AhR. These intriguing findings show that not only is induction of 1A1 and 2F1 caused by 3MI metabolites, rather than 3MI itself, but transcriptional activation of these pulmonary genes occurs through disparate mechanisms. Thus, the induction process, and subsequent increased bioactivation of 3MI to toxic intermediates, is a facile process that might enhance the acute toxicity and/or mutagenicity of this chemical.


Figures

Figure 1
Figure 1
Time Course of 3MI-Mediated Cytochrome P450 Induction in NHBE Cells. Quantitative real-time PCR analysis revealed maximal induction of CYP1A1 (A) transcript expression 4 hours following 10 µM 3MI exposure, whereas maximal induction of CYP2F1 (B) transcript expression occurred 1 hour after exposure. Values were standardized to Psmb6 transcript expression and are the means of 3 separate experiments * p < 0.05 compared to vehicle (DMSO)-treated control (white bar). Western blot analysis of CYP1A1 and CYP2F1 protein expression (C) after exposure to 10 µM 3MI at various time points revealed peak induction of protein expression at 4 hours, after which point protein levels decreased to initial levels. GAPDH was included as a loading control. Protein expression levels were the means of 3 separate experiments and were verified using densitometric analysis (D). * p < 0.05 compared to the levels at 0 hours.
Figure 1
Figure 1
Time Course of 3MI-Mediated Cytochrome P450 Induction in NHBE Cells. Quantitative real-time PCR analysis revealed maximal induction of CYP1A1 (A) transcript expression 4 hours following 10 µM 3MI exposure, whereas maximal induction of CYP2F1 (B) transcript expression occurred 1 hour after exposure. Values were standardized to Psmb6 transcript expression and are the means of 3 separate experiments * p < 0.05 compared to vehicle (DMSO)-treated control (white bar). Western blot analysis of CYP1A1 and CYP2F1 protein expression (C) after exposure to 10 µM 3MI at various time points revealed peak induction of protein expression at 4 hours, after which point protein levels decreased to initial levels. GAPDH was included as a loading control. Protein expression levels were the means of 3 separate experiments and were verified using densitometric analysis (D). * p < 0.05 compared to the levels at 0 hours.
Figure 2
Figure 2
Concentration Response of 3MI-Mediated Cytochrome P450 Induction in NHBE Cells. 4 hour incubation with increasing concentrations of 3MI (gray bars) produced a concentration-dependent induction of CYP1A1 (A) transcript expression. A similar effect on CYP2F1 (B) transcript expression was observed after 1 hour. Values were standardized to Psmb6 transcript expression and are the average of 3 separate experiments * p < 0.05 compared to vehicle (DMSO)-treated control (white bar). Western blot analysis of CYP1A1 and CYP2F1 protein expression (C) after 4 hours of exposure to increasing concentrations of 3MI revealed increased protein expression at 10 µM 3MI. Protein induction was attenuated by a 30-minute pre-treatment with ABT for both enzymes. GAPDH was included as a loading control. Protein expression levels were the means of 3 separate experiments and were verified using densitometric analysis (D). * p < 0.05 compared to vehicle (DMSO)-treated control
Figure 2
Figure 2
Concentration Response of 3MI-Mediated Cytochrome P450 Induction in NHBE Cells. 4 hour incubation with increasing concentrations of 3MI (gray bars) produced a concentration-dependent induction of CYP1A1 (A) transcript expression. A similar effect on CYP2F1 (B) transcript expression was observed after 1 hour. Values were standardized to Psmb6 transcript expression and are the average of 3 separate experiments * p < 0.05 compared to vehicle (DMSO)-treated control (white bar). Western blot analysis of CYP1A1 and CYP2F1 protein expression (C) after 4 hours of exposure to increasing concentrations of 3MI revealed increased protein expression at 10 µM 3MI. Protein induction was attenuated by a 30-minute pre-treatment with ABT for both enzymes. GAPDH was included as a loading control. Protein expression levels were the means of 3 separate experiments and were verified using densitometric analysis (D). * p < 0.05 compared to vehicle (DMSO)-treated control
Figure 3
Figure 3
Mechanism of 3MI-Mediated CYP1A1 Induction in NHBE Cells. 1 hour pre-treatment with 5 mM ABT (gray and black diagonally striped bar), 4 µM actinomycin D (black bar), or 1 µM α-NF (horizontally striped gray and black bar) were sufficient to attenuate 10 µM 3MI-mediated (gray bar) CYP1A1 transcript induction (A). Pre-treatment with 1 µM α-NF also inhibited CYP1A1 induction mediated by 1 µM β-NF (white bar with open boxes). 1 hour pre-treatment with 35 µM cycloheximide (vertically striped gray and black bar) induced 3MI-mediated CYP1A1 expression more than 3-fold over that induced by 3MI (gray bar) treatment alone. ABT pre-treatment was sufficient to attenuate 3MI- and cycloheximide (gray and black checkered bar)-mediated superinduction of CYP1A1, while ABT co-treatment with cycloheximide (black and white checkered bar) did not attenuate induction compared to cycloheximide-mediated (vertically striped black and white bar) induction alone (A). CYP2F1 transcript expression (B) was successfully attenuated by 5 mM ABT, 35 µM cycloheximide, and 4 µM actinomycin D, whereas 1 µM β-NF did not significantly alter CYP2F1 transcript expression compared to vehicle treated control, indicating that the mechanisms of induction for CYP1A1 and CYP2F1 differ. Data are the average of 3 separate experiments and are standardized to Psmb6 transcript expression. * p < 0.05 compared to vehicle (DMSO) treated control (white bar), ‡ p < 0.05 compared to 10 µM 3MI (gray bar).
Figure 4
Figure 4
3MI-Mediated CYP1A1 Induction is Linked to DNA Damage in NHBE Cells. Comet assay analysis revealed that 1 hour pre-treatment with 5 mM ABT (gray and black diagonally striped bar) or 1 µM α-NF (gray and black horizontally striped bar) significantly attenuated 10 µM 3MI-mediated DNA damage, whereas treatment with ABT (white and black vertically striped bar) or α-NF alone (white and black horizontally striped bar) did not significantly alter DNA damage levels. 1 hour pre-treatment with the positive control 1 µM β-NF (gray and black bar with open boxes) or 35 µM cycloheximide (gray and black vertically striped bar) increased the levels of 3MI-mediated DNA damage to a greater extent than either 3MI (gray bar), β-NF (white and black bar with open boxes), or cycloheximide (white and black horizontally striped bar) treatment alone. DNA damage induced by 3MI co-treatment with cycloheximide was attenuated by pre-treatment with ABT (gray and black checkered bar). Data are the average OTM from 3 separate experiments. * p < 0.05 compared to vehicle (DMSO)-treated control (white bar), ‡ p < 0.05 compared to 10µM 3MI (gray bar).
Scheme I
Scheme I
Disparate Pathways of Hepatic and Respiratory Metabolism of 3MI. Formation of the 3-methyleneindolenine (3MEIN) reactive intermediate is primarily catalyzed by lung enzymes such as CYP1A1 and CYP2F1. Conversely, the major excreted metabolites such as 3-methoxindole and indole-3-carbinol are produced by several P450 enzymes that are predominately expressed in the liver. Metabolism of 3MI through 3MEIN could produce the dimer shown here, ICZ, that could be an inducer of CYP1A1 and CYP2F1. Nu = protein, DNA, glutathione

References

    1. Yost GS. Mechanisms of 3-methylindole pneumotoxicity. Chem Res Toxicol. 1989;2:273–279. - PubMed
    1. Yost GS. Mechanisms of 3-methylindole pneumotoxicity. Chem Res Toxicol. 1989;2:273–279. - PubMed
    1. Hoffmann D, Rathkamp G. Quantitative determination of 1-alkylindoles in cigarette smoke. Anal Chem. 1970;42:366–370. - PubMed
    1. Nelson DR, K L, Kamataki T, Stegemann JJ, Feyereisen R, Wazman DJ, Waterman MR, Gotoh O, Coon MJ, Estabrook RW, Gunsalus IC, Nebert DW. P450 superfamily: update on new sequences, gene mapping, accession numbers and nomenclature. Pharmacogenetics. 1996;6:1–42. - PubMed
    1. Ding X, Kaminsky LS. Human extrahepatic cytochromes P450: function in xenobiotic metabolism and tissue-selective chemical toxicity in the respiratory and gastrointestinal tracts. Annu Rev Pharmacol Toxicol. 2003;43:149–173. - PubMed

Publication types

MeSH terms