

doi: 10.1186/gb-2010-11-2-r23.
Epub 2010 Feb 26.
Identification of functional modules that correlate with phenotypic difference: the influence of network topology
Affiliations
- PMID: 20187943
- PMCID: PMC2872883
- DOI: 10.1186/gb-2010-11-2-r23
Item in Clipboard
Identification of functional modules that correlate with phenotypic difference: the influence of network topology
Genome Biol.
2010.
Abstract
One of the important challenges to post-genomic biology is relating observed phenotypic alterations to the underlying collective alterations in genes. Current inferential methods, however, invariably omit large bodies of information on the relationships between genes. We present a method that takes account of such information - expressed in terms of the topology of a correlation network - and we apply the method in the context of current procedures for gene set enrichment analysis.
Figures
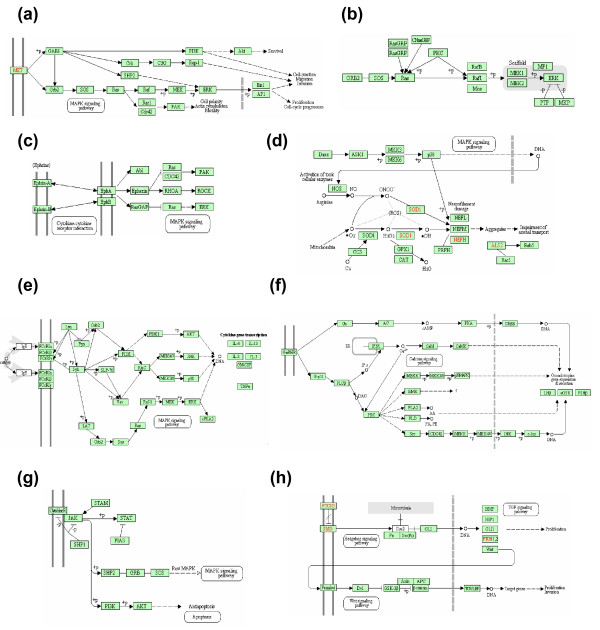
Pathways adapted from KEGG. (a) Renal cell carcinoma. (b) MAPK signaling pathway. (c) Axon guidance. (d) Amyotrophic lateral sclerosis. (e) Fcε RI signaling pathway. (f) Gonadotropin-releasing hormone signaling pathway. (g) Jak-STAT signaling pathway. (h) Basal cell carcinoma. Red indicates an abnormality.
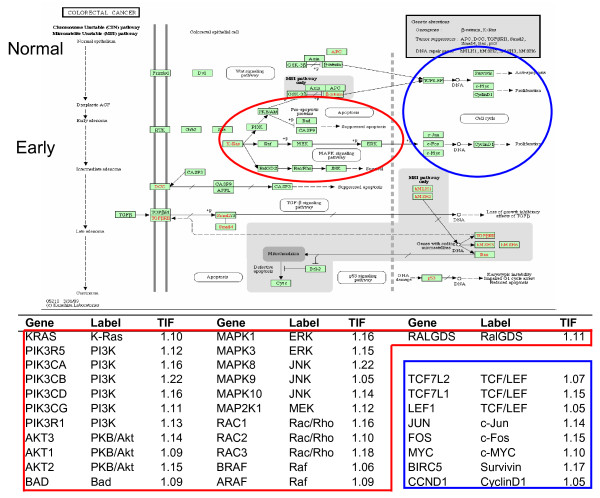
TIF scores for genes in the KEGG colorectal cancer pathway. The regions circled in red and blue are clustered around the early stages of carcinoma, in accordance with the tissue origin being early stage.
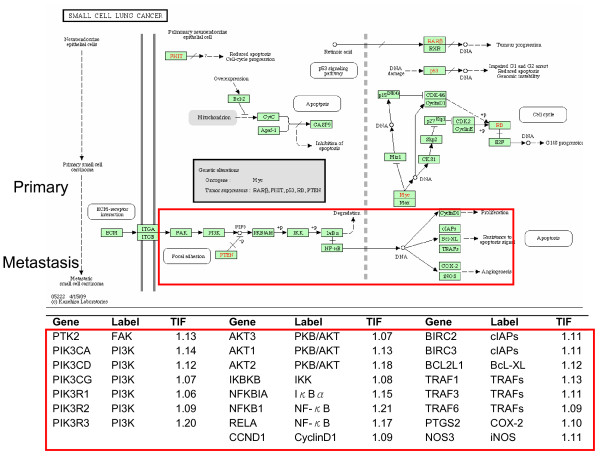
TIF scores for genes in the KEGG small cell lung cancer pathway. The identification of genes associated with primary and metastatic stages is consistent with the tissue of origin being stage heterogeneous, and not purely primary.
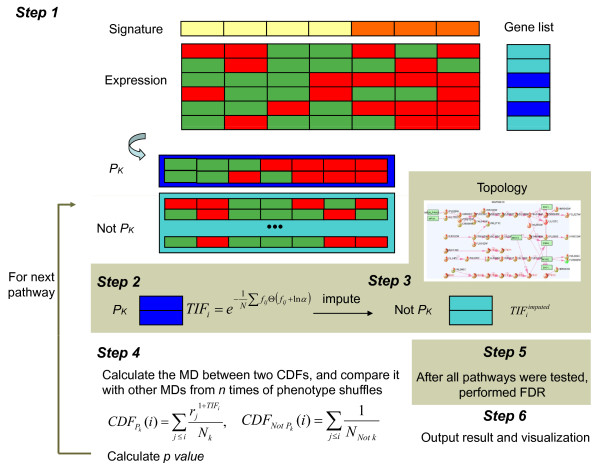
Algorithmic scheme of PWEA. In step 1, two different colors (yellow and orange) in the signature vector indicate two phenotypes (for example, normal and cancer). Blue rectangles in the gene list vector indicate genes in a particular pathway Pk. For a pathway k, the expression profiles are categorized into two groups: Pk (blue) and its complement, 'Not Pk' (cyan). In step 2 the TIF scores for genes in Pk are calculated. In step 3, TIF scores of the genes in 'Not Pk' set is computed. In step 4, the maximum deviation (MD) between two cumulative distribution functions is computed. After calculating MD for each of n iterations of phenotype shuffling, the fraction of occurrences of shuffled MDs ≥ the original MD is the P-value of Pk. In step 5, after all pathways have been tested, FDR is used to correct for multiple testing. In step 6, results and a KEGG markup language topology file for visualization in visANT [68] are the final output. CDF, cumulative distribution function.
References
-
- Goeman JJ, Buhlmann P. Analyzing gene expression data in terms of gene sets: methodological issues. Bioinformatics. 2007;23:980–987. - PubMed
-
- Pavlidis P, Lewis DP, Noble WS. Exploring gene expression data with class scores. Pac Symp Biocomput. 2002. pp. 474–485. - PubMed
-
- Mootha VK, Lindgren CM, Eriksson KF, Subramanian A, Sihag S, Lehar J, Puigserver P, Carlsson E, Ridderstrale M, Laurila E, Houstis N, Daly MJ, Patterson N, Mesirov JP, Golub TR, Tamayo P, Spiegelman B, Lander ES, Hirschhorn JN, Altshuler D, Groop LC. PGC-1alpha-responsive genes involved in oxidative phosphorylation are coordinately downregulated in human diabetes. Nat Genet. 2003;34:267–273. - PubMed
Publication types
MeSH terms
Grants and funding
LinkOut - more resources
Full Text Sources
