. 2010 Feb 26:11:142.
doi: 10.1186/1471-2164-11-142.

TobEA: an atlas of tobacco gene expression from seed to senescence

Affiliations

TobEA: an atlas of tobacco gene expression from seed to senescence

Kieron D Edwards et al. BMC Genomics. .

Abstract

Background: Transcriptomics has resulted in the development of large data sets and tools for the progression of functional genomics and systems biology in many model organisms. Currently there is no commercially available microarray to allow such expression studies in Nicotiana tabacum (tobacco).

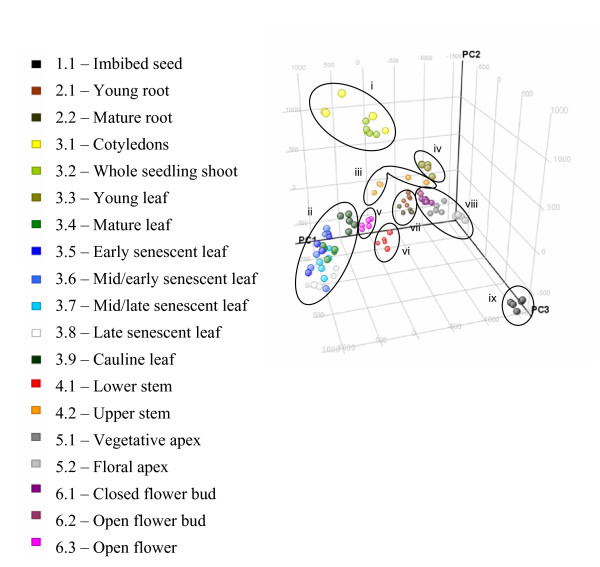
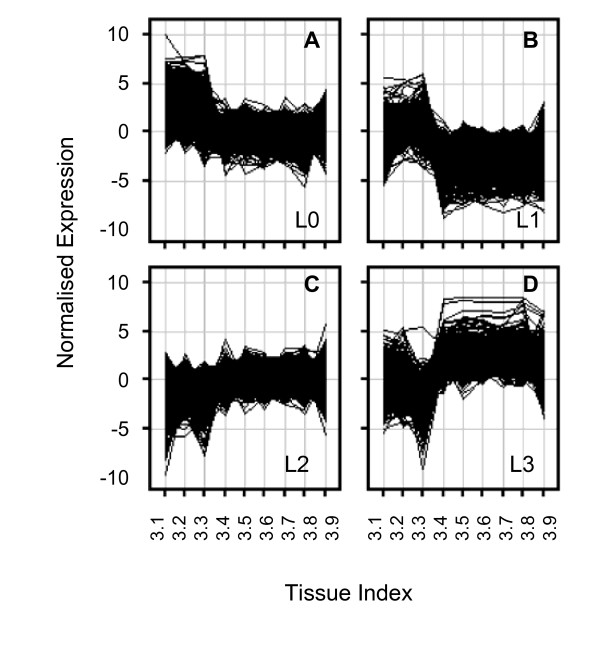
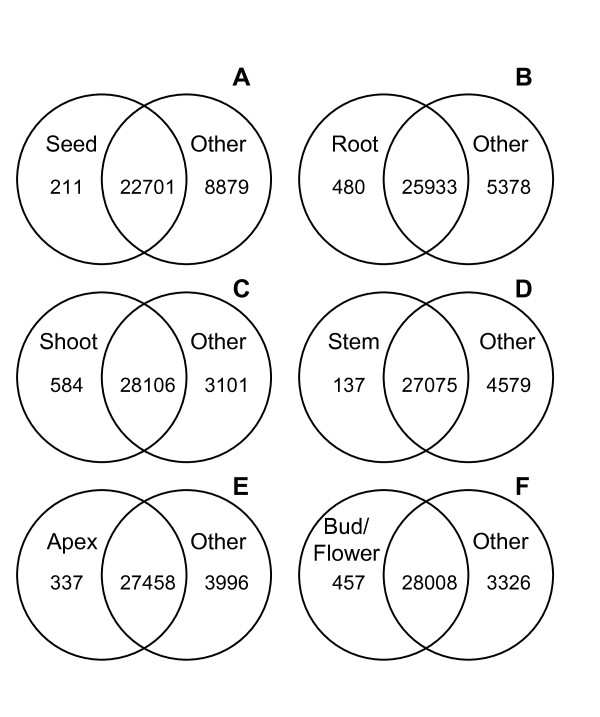
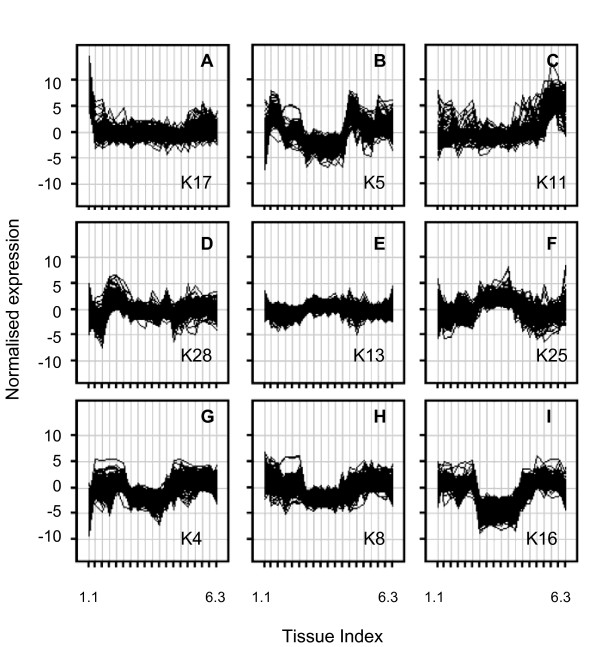
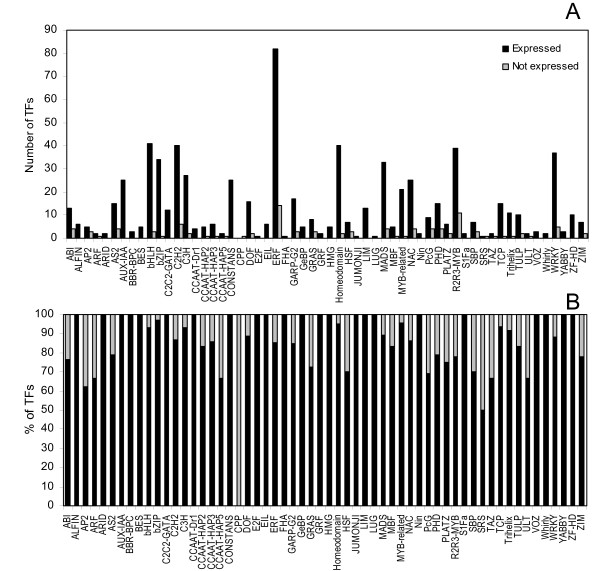
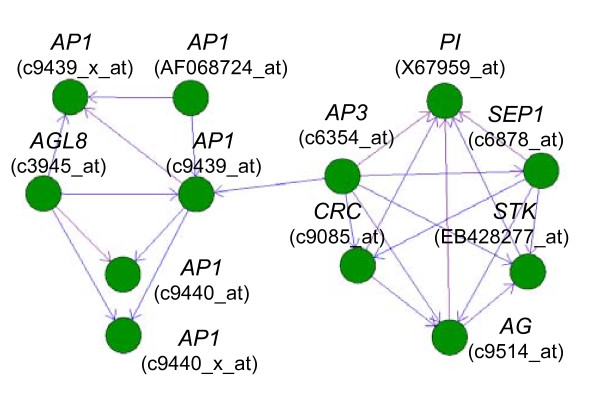
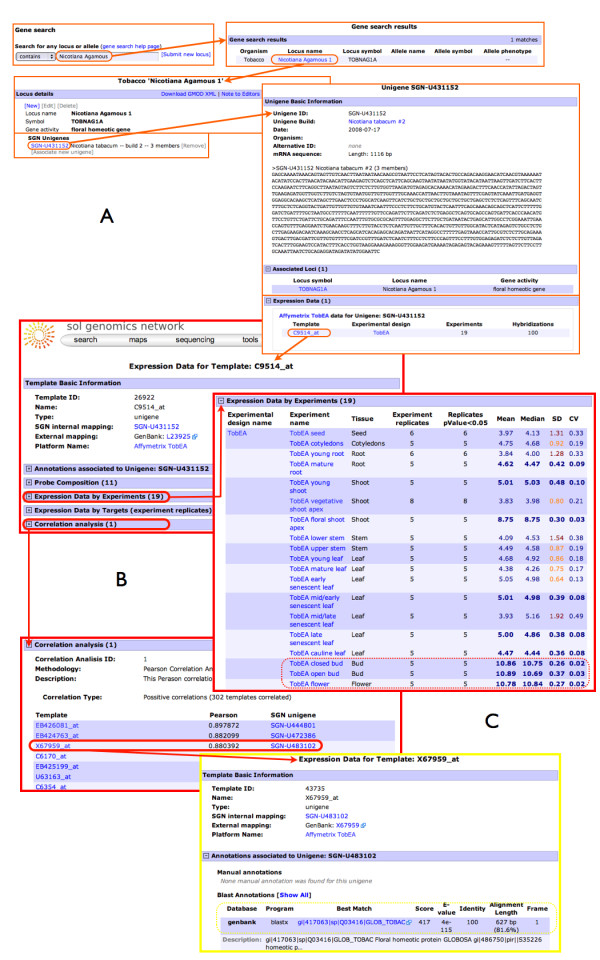
Results: A custom designed Affymetrix tobacco expression microarray was generated from a set of over 40k unigenes and used to measure gene expression in 19 different tobacco samples to produce the Tobacco Expression Atlas (TobEA). TobEA provides a snap shot of the transcriptional activity for thousands of tobacco genes in different tissues throughout the lifecycle of the plant and enables the identification of the biological processes occurring in these different tissues. 772 of 2513 transcription factors previously identified in tobacco were mapped to the array, with 87% of them being expressed in at least one tissue in the atlas. Putative transcriptional networks were identified based on the co-expression of these transcription factors. Several interactions in a floral identity transcription factor network were consistent with previous results from other plant species. To broaden access and maximise the benefit of TobEA a set of tools were developed to provide researchers with expression information on their genes of interest via the Solanaceae Genomics Network (SGN) web site. The array has also been made available for public use via the Nottingham Arabidopsis Stock Centre microarray service.

Conclusions: The generation of a tobacco expression microarray is an important development for research in this model plant. The data provided by TobEA represents a valuable resource for plant functional genomics and systems biology research and can be used to identify gene targets for both fundamental and applied scientific applications in tobacco.


Figures

Figure 1
Figure 1
Tobacco organ expression trends. Principal Components Analysis (PCA) of the microarray data for the 95 samples in TobEA. PCA is a statistical method that reduces the dimensionality of multidimensional data-sets and enables the variance in gene expression for microarray samples to be represented across a set of vectors. Data points representing individual MAS5 pre-processed tobacco microarray samples are plotted within the first three PC vectors. Samples occupying similar position in PC space share similar gene expression trends. Black oblongs in chart represent clusters of samples occupying similar position in PC space (see inset labels i to ix). Data points are coloured according to sample tissue of origin, with biological replicate samples coloured identically (see inset key for TTI identity).
Figure 2
Figure 2
Changes in gene expression during leaf development. Genes showing differential expression between young and mature leaf samples were identified (see text for details). These genes were clustered by K-means into 4 groups L0 (A), L1 (B), L2 (C) and L3 (D). Expression data are normalised to the median across all 19 tissues in TobEA (y-axis) and plotted against the leaf development samples (TTI 3.1 - 3.9; x-axis).
Figure 3
Figure 3
Tobacco tissue-specific gene expression. Venn diagram comparing genes identified as expressed in seed (TTI 1; A), root (TTI 2; B), shoot (TTI 3; C), stem (TTI 4; D), apex (TTI 5; E) and bud/flower (TTI 6; F) samples versus those identified as expressed in any of the other 5 tissue types.
Figure 4
Figure 4
Tobacco gene co-expression. 30009 genes identified as differentially expressed across the TobEA samples were K-means clustered into 30 groups of co-expressed genes. Panels show normalised gene expression levels (y-axis) plotted across all 19 TobEA tissue types (x-axis) for clusters K17 (A), K5 (B), K11 (C), K28 (D), K13 (E), K25 (F), K4 (G), K8 (H) and K16 (I). The full set of 30 clusters can be seen in Additional file 6: Tobacco gene co-expression.ppt.
Figure 5
Figure 5
Tobacco TF expression. 772 of the 2513 TOBFAC TFs were mapped by BLAST searches to 850 probe sets on the tobacco microarray (See methods). Bar charts show the number (A) and percentage (B) of probe sets representing transcription factors in each TOBFAC family that were identified as expressed in at least one TobEA tissue type. Black bars represent the number/percentage of expressed genes and grey bars the non-expressed genes. TF families are identified along the x-axis.
Figure 6
Figure 6
Tobacco floral identity TF co-expression network. Expression data for the TOBFAC TFs present on the microarray was used to generate co-expression networks with Biolayout 3D [33]. Figure shows a representative gene network consisting of TFs involved in floral meristem determination and identity. Genes are represented by green nodes. Edges between nodes, indicating an interaction based on co-expression, are represented by arrows. Respective gene and probe names are given for each node.
Figure 7
Figure 7
Data access using SEDM (SGN Expression Data Module). Screen shots summarising user access to expression data via the SGN Expression Data Module. Data is available to users from a direct search or via from a search of another SGN element (A). The expression data is shown in the template page with data about the probes, annotation and correlation analysis associated (B). The correlation analysis section can be used to access to other probe-sets with similar expression across the TobEA microarray dataset (C).

References

    1. Hoekema A, Hirsch PR, Hooykaas PJJ, Schilperoort RA. A binary plant vector strategy based on separation of vir- and T-region of the Agrobacterium tumefaciens Ti-plasmid. Nature. 1983;303(5913):179–180. doi: 10.1038/303179a0. - DOI
    1. Gerstel DU. Segregation in new allopolyploids of Nicotiana. I. Comparison of 6× (N. tabacum × tomentosiformis) and 6× (N. tabacum × otophora) Genetics. 1960;45:1723–1734. - PMC - PubMed
    1. Goodspeed TH. The genus Nicotiana. Massachusetts: Waltham; 1954.
    1. Murad L, Lim KY, Christopodulou V, Matyasek R, Lichtenstein CP, Kovarik A, Leitch AR. The origin of tobacco's T genome is traced to a particular lineage within Nicotiana tomentosiformis (Solanaceae) Am J Bot. 2002;89(6):921–928. doi: 10.3732/ajb.89.6.921. - DOI - PubMed
    1. Leitch IJ, Hanson L, Lim KY, Kovarik A, Chase MW, Clarkson JJ, Leitch AR. The Ups and Downs of Genome Size Evolution in Polyploid Species of Nicotiana (Solanaceae) Ann Bot. 2008;101(6):805–814. doi: 10.1093/aob/mcm326. - DOI - PMC - PubMed