

Anopheles gambiae: historical population decline associated with regional distribution of insecticide-treated bed nets in western Nyanza Province, Kenya
- PMID: 20187956
- PMCID: PMC2838909
- DOI: 10.1186/1475-2875-9-62
Anopheles gambiae: historical population decline associated with regional distribution of insecticide-treated bed nets in western Nyanza Province, Kenya
Abstract
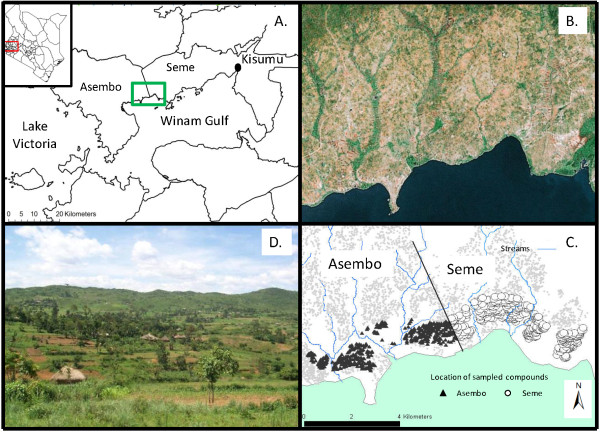
Background: High coverage of insecticide-treated bed nets in Asembo and low coverage in Seme, two adjacent communities in western Nyanza Province, Kenya; followed by expanded coverage of bed nets in Seme, as the Kenya national malaria programme rolled out; provided a natural experiment for quantification of changes in relative abundance of two primary malaria vectors in this holoendemic region. Both belong to the Anopheles gambiae sensu lato (s.l.) species complex, namely A. gambiae sensu stricto (s.s.) and Anopheles arabiensis. Historically, the former species was proportionately dominant in indoor resting collections of females.
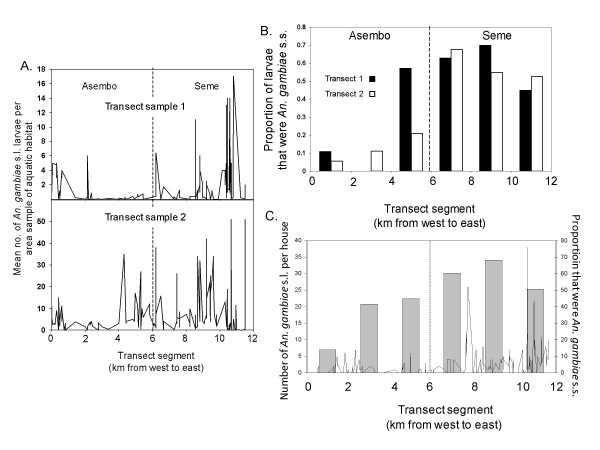
Methods: Data of the relative abundance of adult A. gambiae s.s. and A. arabiensis sampled from inside houses were obtained from the literature from 1970 to 2002 for sites west of Kisumu, Kenya, to the region of Asembo ca. 50 km from the city. A sampling transect was established from Asembo (where bed net use was high due to presence of a managed bed net distribution programme) eastward to Seme, where no bed net programme was in place. Adults of A. gambiae s.l. were sampled from inside houses along the transect from 2003 to 2009, as were larvae from nearby aquatic habitats, providing data over a nearly 40 year period of the relative abundance of the two species. Relative proportions of A. gambiae s.s. and A. arabiensis were determined for each stage by identifying species by the polymerase chain reaction method. Household bed net ownership was measured with surveys during mosquito collections. Data of blood host choice, parity rate, and infection rate for Plasmodium falciparum in A. gambiae s.s. and A. arabiensis were obtained for a sample from Asembo and Seme from 2005.
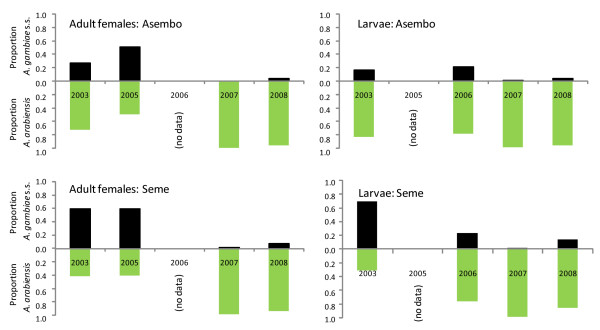
Results: Anopheles gambiae s.s. adult females from indoor collections predominated from 1970 to 1998 (ca. 85%). Beginning in 1999, A. gambiae s.s decreased proportionately relative to A. arabiensis, then precipitously declined to rarity coincident with increased bed net ownership as national bed net distribution programmes commenced in 2004 and 2006. By 2009, A. gambiae s.s. comprised proportionately ca. 1% of indoor collections and A. arabiensis 99%. In Seme compared to Asembo in 2003, proportionately more larvae were A. gambiae s.s., larval density was higher, and more larval habitats were occupied. As bed net use rose in Seme, the proportion of A. gambiae larvae declined as well. These trends continued to 2009. Parity and malaria infection rates were lower in both species in Asembo (high bed net use) compared to Seme (low bed net use), but host choice did not vary within species in both communities (predominantly cattle for A. arabiensis, humans for A. gambiae s.s.).
Conclusions: A marked decline of the A. gambiae s.s. population occurred as household ownership of bed nets rose in a region of western Kenya over a 10 year period. The increased bed net coverage likely caused a mass effect on the composition of the A. gambiae s.l. species complex, resulting in the observed proportionate increase in A. arabiensis compared to its closely related sibling species, A. gambiae s.s. These observations are important in evaluating the process of regional malaria elimination, which requires sustained vector control as a primary intervention.
Figures


References
-
- Enayati A, Lines J, Maharaj R, Hemingway J. In: Shrinking the Malaria Map: A Prospectus on Malaria Elimination, Chapter 9. Feachem RGA, Phillips AA, Targett GA, editor. Chapter 9. San Francisco: The Global Health Group, Global Health Sciences, University of California, San Francisco; 2009. Suppressing the vector.
-
- Taylor RN, Hill MD, Stewart DC, Slatter R, Gichanga M. A field evaluation of permethrin (OMS-182l) and Nrdc 161 (OMS-l998) for residual control of mosquitoes. Mosq News. 1981;41:423–433.
Publication types
MeSH terms
Substances
Grants and funding
LinkOut - more resources
Full Text Sources
Research Materials
