. 2010 Feb 27:11:111.
doi: 10.1186/1471-2105-11-111.

Modeling expression quantitative trait loci in data combining ethnic populations

Affiliations

Modeling expression quantitative trait loci in data combining ethnic populations

Ching-Lin Hsiao et al. BMC Bioinformatics. .

Abstract

Background: Combining data from different ethnic populations in a study can increase efficacy of methods designed to identify expression quantitative trait loci (eQTL) compared to analyzing each population independently. In such studies, however, the genetic diversity of minor allele frequencies among populations has rarely been taken into account. Due to the fact that allele frequency diversity and population-level expression differences are present in populations, a consensus regarding the optimal statistical approach for analysis of eQTL in data combining different populations remains inconclusive.

Results: In this report, we explored the applicability of a constrained two-way model to identify eQTL for combined ethnic data that might contain genetic diversity among ethnic populations. In addition, gene expression differences resulted from ethnic allele frequency diversity between populations were directly estimated and analyzed by the constrained two-way model. Through simulation, we investigated effects of genetic diversity on eQTL identification by examining gene expression data pooled from normal quantile transformation of each population. Using the constrained two-way model to reanalyze data from Caucasians and Asian individuals available from HapMap, a large number of eQTL were identified with similar genetic effects on the gene expression levels in these two populations. Furthermore, 19 single nucleotide polymorphisms with inter-population differences with respect to both genotype frequency and gene expression levels directed by genotypes were identified and reflected a clear distinction between Caucasians and Asian individuals.

Conclusions: This study illustrates the influence of minor allele frequencies on common eQTL identification using either separate or combined population data. Our findings are important for future eQTL studies in which different datasets are combined to increase the power of eQTL identification.


Figures

Figure 1
Figure 1
Simulations without inclusion of baseline differences I. The allele frequency of population 0 (P0) was analyzed with respect to (A) type I error rate (with D = 0 for d = 0, 0.1, 0.2) or (B) power of eQTL identification; upper and lower panels represent E = 0.3 and 0.5, respectively. The three color bars represent the three different testing methods as follows: purple, IG; red, QT; blue, CTWM.
Figure 2
Figure 2
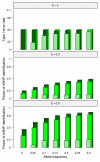
Simulations without inclusion of baseline differences II. The allele frequency of group 0 (P0) was analyzed with respect to type I error rate (upper panel, E = 0) and power (middle panel, E = 0.3; lower panel, E = 0.5) of eSNP identification, respectively. The three color bars represent the three different allele frequency differences as follows: light green, d = 0; green, d = 0.1; dark green, d = 0.2.
Figure 3
Figure 3
Estimates in simulations. The dots are means of the formula image estimated by CTWM (blue) and QT (red) methods under null (upper panel, E = 0) and alternative (lower panel, E = 0.5) hypotheses. Arrows of each dot represent the 95% confidence interval calculated from 10,000 simulations. Dash lines are the true values of τ•1 used in the simulations.
Figure 4
Figure 4
Summary of SNP-GE data generated using the IG, CTWM and CTWM -GS methods.
Figure 5
Figure 5
Summary of Genetic Score analysis. |GS| proportion was calculated by |GS|/(|BD| + |GS|) as shown in the x-axis. The histogram is a representation of |GS| proportion frequencies (indicated on the left-axis in black) underlying 1,689 SNP-GE pairs identified by CTWM-GS method. The blue line represents the smooth correlation between |GS| proportion and MAF (minor allele frequency) differences (indicated on the right-axis in blue) estimated by the Lowess method underlying the same 1,689 SNP-GE pairs.
Figure 6
Figure 6
Heatmap of hierarchical clustering. The vertical hierarchical cluster shows that the CEU (black) and Asian (red) populations can be separated by clustering their genotypes as shown in the horizontal hierarchical tree. Upper heatmap: black shading represents individuals homozygous for the upregulated allele, and gray shading represents heterozygous. White shading indicates individuals homozygous for the downregulated allele. The lower heatmap represents expression of the genes corresponding to the eSNPs in the upper heatmap; intensity of red is proportional to degree of expression above the mean, and intensity of green is proportional to degree of expression below the mean.

Similar articles

Cited by

References

    1. Chorley BN, Wang X, Campbell MR, Pittman GS, Noureddine MA, Bell DA. Discovery and verification of functional single nucleotide polymorphisms in regulatory genomic regions: current and developing technologies. Mutat Res. 2008;11(1-2):147–57. doi: 10.1016/j.mrrev.2008.05.001. - DOI - PMC - PubMed
    1. Jansen RC, Nap JP. Regulating gene expression: surprises still in store. Trends Genet. 2004;11(5):223–5. doi: 10.1016/j.tig.2004.03.002. - DOI - PubMed
    1. Zhang W, Ratain MJ, Dolan ME. The HapMap Resource is Providing New Insights into Ourselves and its Application to Pharmacogenomics. Bioinform Biol Insights. 2008;11:15–23. - PMC - PubMed
    1. Cheung VG, Spielman RS, Ewens KG, Weber TM, Morley M, Burdick JT. Mapping determinants of human gene expression by regional and genome-wide association. Nature. 2005;11(7063):1365–9. doi: 10.1038/nature04244. - DOI - PMC - PubMed
    1. Spielman RS, Bastone LA, Burdick JT, Morley M, Ewens WJ, Cheung VG. Common genetic variants account for differences in gene expression among ethnic groups. Nat Genet. 2007;11(2):226–31. doi: 10.1038/ng1955. - DOI - PMC - PubMed

Publication types

LinkOut - more resources