. 2010 May 19;167(3):786-98.
doi: 10.1016/j.neuroscience.2010.02.037. Epub 2010 Feb 24.

Voltage-activated calcium channel expression profiles in mouse brain and cultured hippocampal neurons

Affiliations

Voltage-activated calcium channel expression profiles in mouse brain and cultured hippocampal neurons

B Schlick et al. Neuroscience. .

Abstract

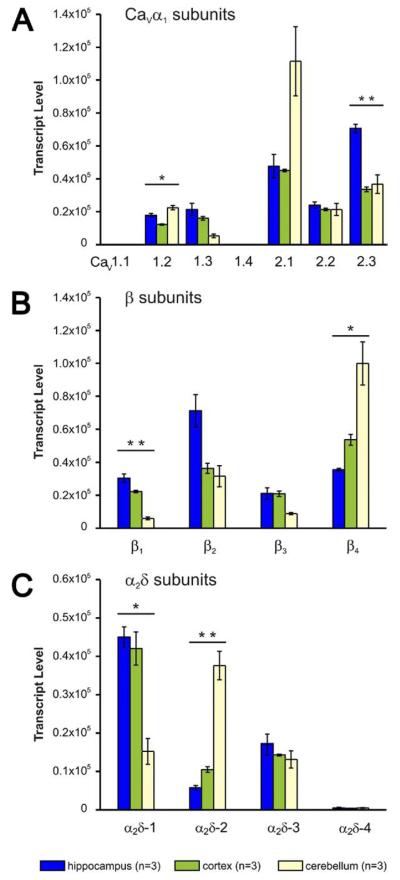
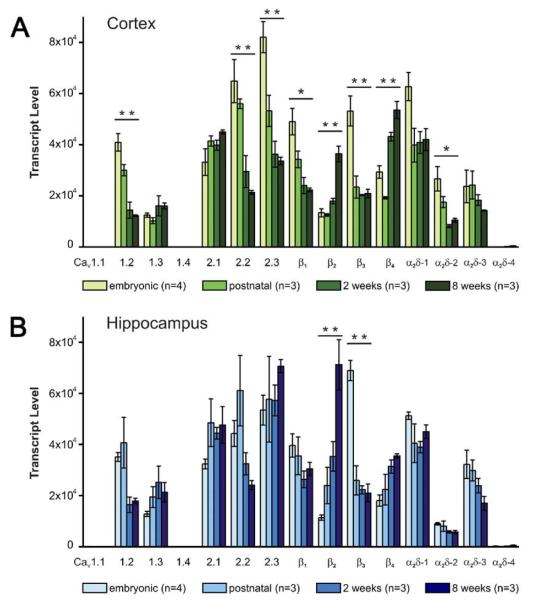
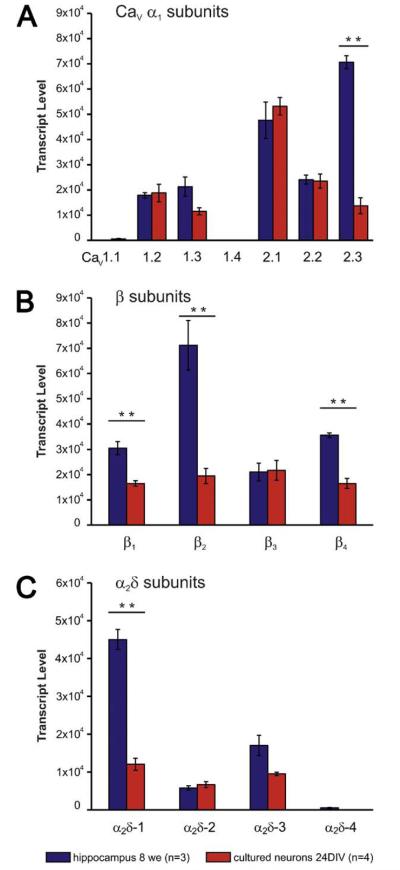
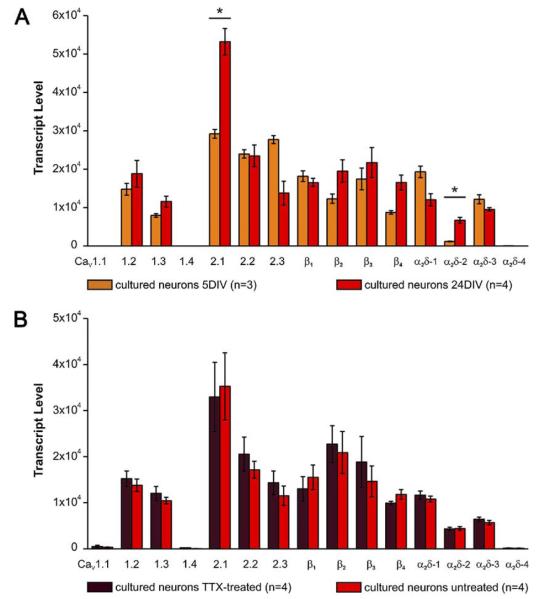
The importance and diversity of calcium signaling in the brain is mirrored by the expression of a multitude of voltage-activated calcium channel (Ca(V)) isoforms. Whereas the overall distributions of alpha(1) subunits are well established, the expression patterns of distinct channel isoforms in specific brain regions and neurons, as well as those of the auxiliary beta and alpha(2)delta subunits are still incompletely characterized. Further it is unknown whether neuronal differentiation and activity induce changes of Ca(V) subunit composition. Here we combined absolute and relative quantitative TaqMan reverse transcription PCR (RT-PCR) to analyze mRNA expression of all high voltage-activated Ca(V) alpha(1) subunits and all beta and alpha(2)delta subunits. This allowed for the first time the direct comparison of complete Ca(V) expression profiles of mouse cortex, hippocampus, cerebellum, and cultured hippocampal neurons. All brain regions expressed characteristic profiles of the full set of isoforms, except Ca(V)1.1 and Ca(V)1.4. In cortex development was accompanied by a general down regulation of alpha(1) and alpha(2)delta subunits and a shift from beta(1)/beta(3) to beta(2)/beta(4). The most abundant Ca(V) isoforms in cerebellum were Ca(V)2.1, beta(4), and alpha(2)delta-2, and in hippocampus Ca(V)2.3, beta(2), and alpha(2)delta-1. Interestingly, cultured hippocampal neurons also expressed the same Ca(V) complement as adult hippocampus. During differentiation specific Ca(V) isoforms experienced up- or down-regulation; however blocking electrical activity did not affect Ca(V) expression patterns. Correlation analysis of alpha(1), beta and alpha(2)delta subunit expression throughout all examined preparations revealed a strong preference of Ca(V)2.1 for beta(4) and alpha(2)delta-2 and vice versa, whereas the other alpha(1) isoforms were non-selectively expressed together with each of the other beta and alpha(2)delta isoforms. Together our results revealed a remarkably stable overall Ca(2+) channel complement as well as tissue specific differences in expression levels. Developmental changes are likely determined by an intrinsic program and not regulated by changes in neuronal activity.


Figures

Fig. 1
Fig. 1
Expression profile of the high voltage-activated Ca2+ channel α1, β, and α2δ subunits in mouse hippocampus, cortex, and cerebellum. (A) Hippocampus (blue), cortex (green), and cerebellum (yellow) express all CaV α1 subunits except CaV1.1 and CaV1.4. Subunit expression levels in hippocampus and cortex are similar with the exception of CaV2.3, which is highest expressed in hippocampus. In cerebellum CaV2.1 is the most abundant isoform, CaV1.2 is higher and CaV1.3 lower than in hippocampus and cortex. CaV2.2 is uniformly expressed in all three brain regions. (B) mRNA of all four β subunits is present in hippocampus, cortex, and cerebellum. β2 and β4 are the dominant isoforms in hippocampus and cerebellum, respectively. In cortex β subunits are expressed at similar levels. (C) α2δ-1 is the major α2δ isoform in hippocampus and cortex, whereas in cerebellum it is α2δ-2. Levels of α2δ-3 are uniform throughout the brain regions tested. Compared to the other auxiliary subunits α2δ-4 expression levels were negligible, although above the limit of quantification in all qRT-PCR runs. * P<0.05; ** P<0.01; 2-way ANOVA plus post hoc ANOVA with Holm correction; error bars: ±SEM.
Fig. 2
Fig. 2
Developmental changes of CaV subunit mRNA expression in cortex and hippocampus. CaV subunit expression profiles were determined in embryonic (E16), postnatal (PD1), and 2 and 8 weeks old BALB/c mice. (A) During development cortical mRNA levels of CaV1.2, CaV2.2, CaV2.3, β1, β3, and α2δ-2 significantly decline, whereas levels of β2 and β4 increase. Levels of CaV1.3, CaV2.1, and α2δ-1 and α2δ-3 remain stable. (B) In hippocampus the overall developmental changes are less striking than in cortex. However, the increase in β2 and the significant drop of β3 levels between E16 and PD1 are more pronounced. In contrast to whole cortex, levels of CaV2.3 did not decline. Although total mRNA levels are negligible in comparison with the other α2δ subunits, expression of α2δ-4 increases ~20-fold during development. * P<0.05; ** P<0.01; 2-way ANOVA plus post hoc ANOVA with Holm correction; error bars: ±SEM.
Fig. 3
Fig. 3
Expression profile of high voltage-activated Ca2+ channel α1, β, and α2δ subunits in differentiated cultured hippocampal neurons (24 DIV). (A) The majority of α1 subunits show similar expression levels in the cultured neurons as in 8 weeks old hippocampus. However, expression of CaV2.3 was 5-fold lower in cultured neurons. (B) In cultured neurons all β isoforms are expressed at equal amounts, but at significantly lower levels than in hippocampus. (C) α2δ subunits are expressed at equal amounts and generally lower levels than in hippocampal tissue. α2δ-4 levels were analyzed separately in five DIV and 24 DIV old neurons (cf. Fig. 4 and Suppl. Fig. 2), but always below detectability. ** P<0.01; 2-way ANOVA plus post hoc t-test with Holm correction; error bars: ±SEM.
Fig. 4
Fig. 4
Effects of development and neuronal activity on CaV subunit expression in cultured hippocampal neurons. (A) The majority of CaV isoforms shows a slight increase in transcript levels between 5 and 24 DIV. This increase is most obvious for CaV2.1, α2δ-2, and β4. In contrast to the overall trend, amounts of CaV2.3 and α2δ-1 transcripts decrease during in vitro development. (B) Blocking electrical activity by TTX for 24 h did not alter the expression level of any CaV subunit isoform. * P<0.05; 2-way ANOVA plus post hoc t-test with Holm correction; error bars: ±SEM.
Fig. 5
Fig. 5
Correlation analysis of CaV α1 subunit expression with individual β and α2δ isoforms. Correlation coefficients were calculated between the transcript amounts of the individual α1 and the auxiliary β and α2δ subunits including measurements from all tissue and culture preparations. The abscissa represents the size and direction of the correlation coefficients whereby direct (positive) and indirect (negative) coefficients are indicated by green and red bars, respectively. Asterisks mark significant correlations and the gray area indicates the cut-off (r=0.4) for weak correlations. (A) Correlation analysis clearly identified the previously demonstrated association of the CaV2.1 α1 subunit with β4 and α2δ-2. Interestingly, CaV1.2, CaV2.2, and CaV2.3 showed similar degrees of correlations with the same set of β and α2δ subunits. Expression of CaV1.3 did not reveal a strong correlation with any auxiliary subunit. (B) Similar correlation coefficients were identified for CaV2.1 and CaV2.3 by including only the measurements from cultured hippocampal neurons. * P<0.05; ** P<0.01; Pearson correlation.

References

    1. Arikkath J, Campbell KP. Auxiliary subunits: essential components of the voltage-gated calcium channel complex. Curr Opin Neurobiol. 2003;13:298–307. - PubMed
    1. Ball SL, Powers PA, Shin HS, Morgans CW, Peachey NS, Gregg RG. Role of the beta(2) subunit of voltage-dependent calcium channels in the retinal outer plexiform layer. Invest Ophthalmol Vis Sci. 2002;43:1595–1603. - PubMed
    1. Barclay J, Balaguero N, Mione M, Ackerman SL, Letts VA, Brodbeck J, Canti C, Meir A, Page KM, Kusumi K, Perez-Reyes E, Lander ES, Frankel WN, Gardiner RM, Dolphin AC, Rees M. Ducky mouse phenotype of epilepsy and ataxia is associated with mutations in the Cacna2d2 gene and decreased calcium channel current in cerebellar Purkinje cells. J Neurosci. 2001;21:6095–6104. - PMC - PubMed
    1. Barnes S, Kelly ME. Calcium channels at the photoreceptor synapse. Adv Exp Med Biol. 2002;514:465–476. - PubMed
    1. Bender R, Lange S. Adjusting for multiple testing—when and how? J Clin Epidemiol. 2001;54:343–349. - PubMed

Publication types

MeSH terms