

Quantitative (31)P NMR spectroscopy and (1)H MRI measurements of bone mineral and matrix density differentiate metabolic bone diseases in rat models
- PMID: 20188225
- PMCID: PMC2875334
- DOI: 10.1016/j.bone.2010.02.020
Quantitative (31)P NMR spectroscopy and (1)H MRI measurements of bone mineral and matrix density differentiate metabolic bone diseases in rat models
Abstract
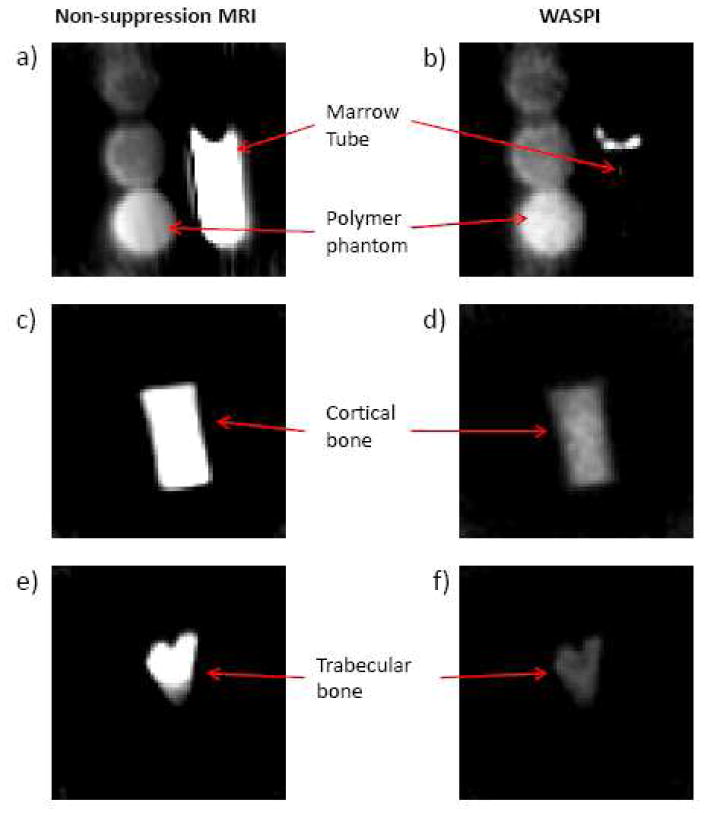
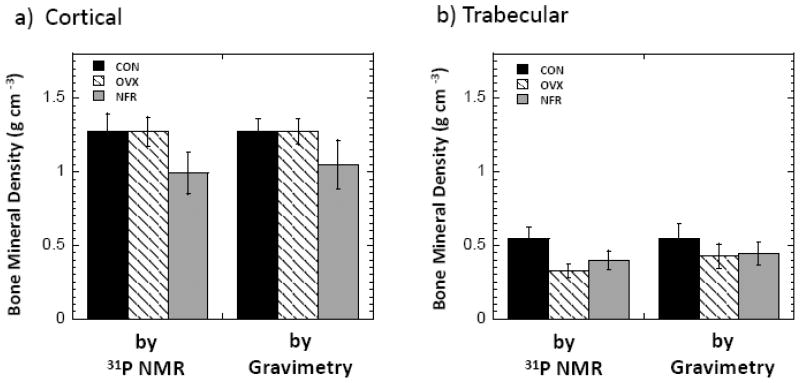
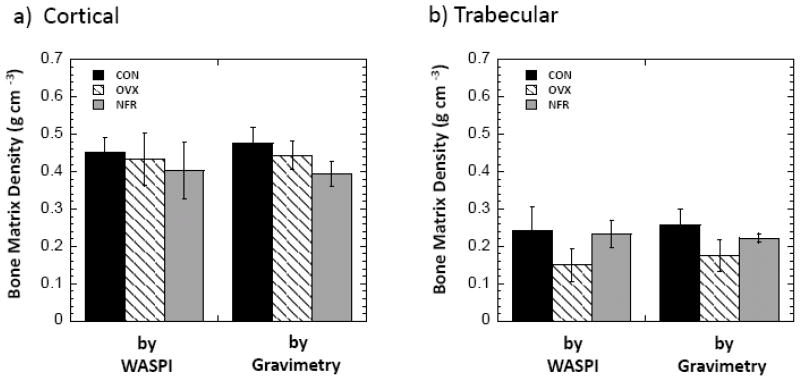
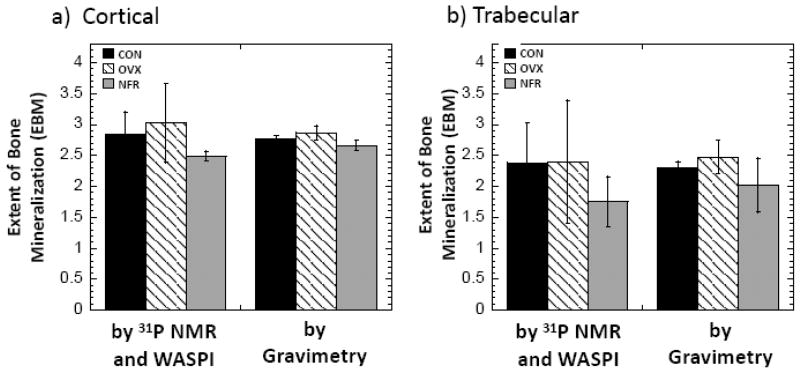
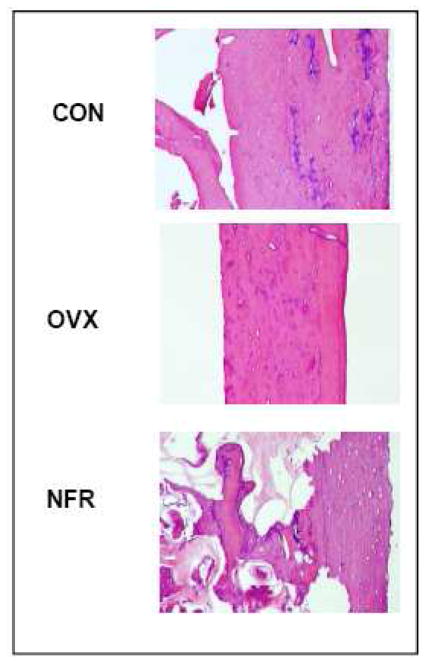
In this study, bone mineral density (BMD) of normal (CON), ovariectomized (OVX), and partially nephrectomized (NFR) rats was measured by (31)P NMR spectroscopy; bone matrix density was measured by (1)H water- and fat-suppressed projection imaging (WASPI); and the extent of bone mineralization (EBM) was obtained by the ratio of BMD/bone matrix density. The capability of these MR methods to distinguish the bone composition of the CON, OVX, and NFR groups was evaluated against chemical analysis (gravimetry). For cortical bone specimens, BMD of the CON and OVX groups was not significantly different; BMD of the NFR group was 22.1% (by (31)P NMR) and 17.5% (by gravimetry) lower than CON. For trabecular bone specimens, BMD of the OVX group was 40.5% (by (31)P NMR) and 24.6% (by gravimetry) lower than CON; BMD of the NFR group was 26.8% (by (31)P NMR) and 21.5% (by gravimetry) lower than CON. No significant change of cortical bone matrix density between CON and OVX was observed by WASPI or gravimetry; NFR cortical bone matrix density was 10.3% (by WASPI) and 13.9% (by gravimetry) lower than CON. OVX trabecular bone matrix density was 38.0% (by WASPI) and 30.8% (by gravimetry) lower than CON, while no significant change in NFR trabecular bone matrix density was observed by either method. The EBMs of OVX cortical and trabecular specimens were slightly higher than CON but not significantly different from CON. Importantly, EBMs of NFR cortical and trabecular specimens were 12.4% and 26.3% lower than CON by (31)P NMR/WASPI, respectively, and 4.0% and 11.9% lower by gravimetry. Histopathology showed evidence of osteoporosis in the OVX group and severe secondary hyperparathyroidism (renal osteodystrophy) in the NFR group. These results demonstrate that the combined (31)P NMR/WASPI method is capable of discerning the difference in EBM between animals with osteoporosis and those with impaired bone mineralization.
Copyright 2010 Elsevier Inc. All rights reserved.
Figures
Similar articles
-
Quantitative 1H Magnetic Resonance Imaging on Normal and Pathologic Rat Bones by Solid-State 1H ZTE Sequence with Water and Fat Suppression.J Magn Reson Imaging. 2024 Dec;60(6):2423-2432. doi: 10.1002/jmri.29361. Epub 2024 Mar 25. J Magn Reson Imaging. 2024. PMID: 38526032
-
Quantitative 31P magnetic resonance imaging on pathologic rat bones by ZTE at 7T.Bone. 2024 Mar;180:116996. doi: 10.1016/j.bone.2023.116996. Epub 2023 Dec 27. Bone. 2024. PMID: 38154764 Free PMC article.
-
Total water, phosphorus relaxation and inter-atomic organic to inorganic interface are new determinants of trabecular bone integrity.PLoS One. 2013 Dec 30;8(12):e83478. doi: 10.1371/journal.pone.0083478. eCollection 2013. PLoS One. 2013. PMID: 24386209 Free PMC article.
-
Quantitative bone matrix density measurement by water- and fat-suppressed proton projection MRI (WASPI) with polymer calibration phantoms.Magn Reson Med. 2008 Dec;60(6):1433-43. doi: 10.1002/mrm.21771. Magn Reson Med. 2008. PMID: 19025909 Free PMC article.
-
Microarchitectural changes in the mandibles of ovariectomized rats: a systematic review and meta-analysis.BMC Oral Health. 2019 Jun 26;19(1):128. doi: 10.1186/s12903-019-0799-0. BMC Oral Health. 2019. PMID: 31242880 Free PMC article.
Cited by
-
A Surrogate Measure of Cortical Bone Matrix Density by Long T2 -Suppressed MRI.J Bone Miner Res. 2015 Dec;30(12):2229-38. doi: 10.1002/jbmr.2580. Epub 2015 Jul 14. J Bone Miner Res. 2015. PMID: 26085307 Free PMC article.
-
New imaging modalities in bone.Curr Rheumatol Rep. 2011 Jun;13(3):241-50. doi: 10.1007/s11926-011-0174-x. Curr Rheumatol Rep. 2011. PMID: 21369797 Free PMC article. Review.
-
Effects of inversion time on inversion recovery prepared ultrashort echo time (IR-UTE) imaging of bound and pore water in cortical bone.NMR Biomed. 2015 Jan;28(1):70-8. doi: 10.1002/nbm.3228. Epub 2014 Oct 28. NMR Biomed. 2015. PMID: 25348196 Free PMC article.
-
Solid-state 31P and 1H chemical MR micro-imaging of hard tissues and biomaterials with magic angle spinning at very high magnetic field.Sci Rep. 2017 Aug 15;7(1):8224. doi: 10.1038/s41598-017-08458-0. Sci Rep. 2017. PMID: 28811630 Free PMC article.
-
Ultrashort echo time (UTE) imaging with bi-component analysis: bound and free water evaluation of bovine cortical bone subject to sequential drying.Bone. 2012 Mar;50(3):749-55. doi: 10.1016/j.bone.2011.11.029. Epub 2011 Dec 10. Bone. 2012. PMID: 22178540 Free PMC article.
References
-
- Bone Health and Osteoporosis: A Report of the Surgeon General. 2004. - PubMed
-
- Sartoris DJ. Quantitative bone mineral analysis. In: Resnick D, editor. Bone and Joint Imaging. 2. Philadelphia: W.B. Saunders Company; 1996. p. 154.
-
- Engelke K, Adams JE, Armbrecht G, Augat P, Bogado CE, Bouxsein ML, Felsenberg D, Ito M, Prevrhal S, Hans DB, Lewiecki EM. Clinical use of quantitative computed tomography and peripheral quantitative computed tomography in the management of osteoporosis in adults: the 2007 ISCD official positions. J Clin Densitom. 2008;11:123–162. - PubMed
-
- Hangartner TN. Thresholding technique for accurate analysis of density and geometry in QCT, pQCT and microCT images. J Musculoskelet Neuronal Interact. 2007;7(1):9–16. - PubMed
-
- Boutroy S, Bouxsein ML, Munoz F, Delmas PD. In vivo assessment of trabecular bone microarchitecture by high-resolution peripheral quantitative computed tomography. J Clin Endocrinol Metab. 2005;90:6508–15. - PubMed
Publication types
MeSH terms
Substances
Grants and funding
LinkOut - more resources
Full Text Sources
Medical
