. 2010 Feb 25;65(4):472-9.
doi: 10.1016/j.neuron.2010.01.033.

Modulation of visual responses by behavioral state in mouse visual cortex

Affiliations

Modulation of visual responses by behavioral state in mouse visual cortex

Cristopher M Niell et al. Neuron. .

Abstract

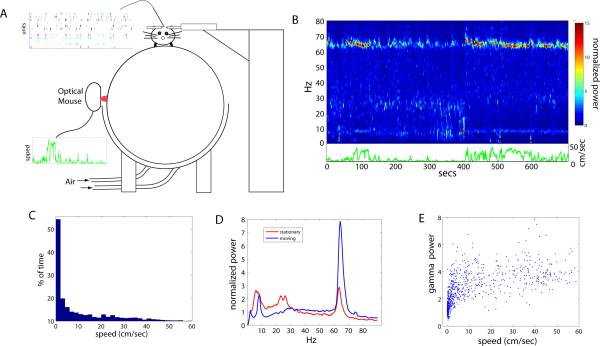
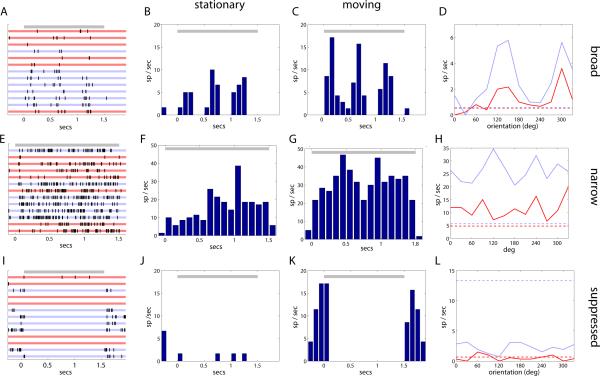
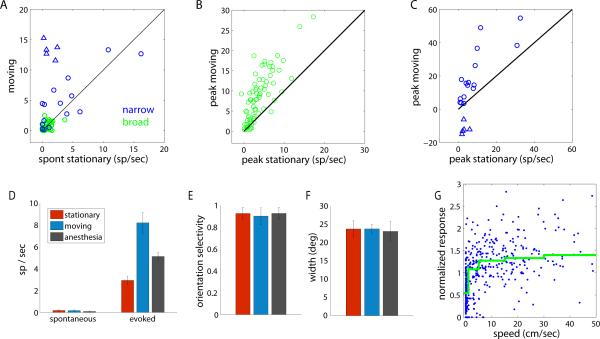
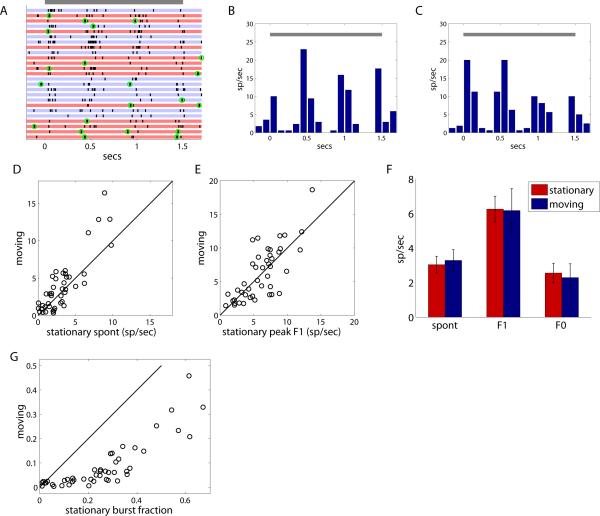
Studies of visual processing in rodents have conventionally been performed on anesthetized animals, precluding examination of the effects of behavior on visually evoked responses. We have now studied the response properties of neurons in primary visual cortex of awake mice that were allowed to run on a freely rotating spherical treadmill with their heads fixed. Most neurons showed more than a doubling of visually evoked firing rate as the animal transitioned from standing still to running, without changes in spontaneous firing or stimulus selectivity. Tuning properties in the awake animal were similar to those measured previously in anesthetized animals. Response magnitude in the lateral geniculate nucleus did not increase with locomotion, demonstrating that the striking change in responsiveness did not result from peripheral effects at the eye. Interestingly, some narrow-spiking cells were spontaneously active during running but suppressed by visual stimuli. These results demonstrate powerful cell-type-specific modulation of visual processing by behavioral state in awake mice.


Figures

Figure 1
Figure 1
Experimental setup and LFP dependence on behavioral state. A) The mouse's head is fixed on top of a styrofoam ball suspended by air. Multisite silicon probes are used to measure spiking units, while data from pair of optical mice are used to calculate the motion of the ball under the mouse. B) Local field potential (LFP) power during the duration of a single recording, with corresponding speed trace shown below in green. C) Distribution of mouse speed, showing a large fraction of time spent stationary and a wide distribution of running speeds. D) Average power spectrum from recording shown in B, during stationary versus moving periods. E) Scatter plot of power around gamma peak (60-70Hz) versus speed of movement, demonstrating a sharp transition between stationary and moving states. See also Figure S1 and Movie S1.
Figure 2
Figure 2
Visual responses in stationary versus moving periods in the awake mouse. Gray bar represents the period of stimulus presentation, to an optimal full-field drifting grating. A) Raster plot for a typical broad-spiking neuron, with individual trials coded as red (stationary) and blue (moving). B,C) Histogram of responses during stationary (B) and moving (C) periods. D) Orientation tuning curve. E-H) show similar results for a typical narrow-spiking neuron. I-L) show similar results representative of a subset of narrow-spiking neurons whose activity is suppressed in response to visual stimuli. See also Figure S2.
Figure 3
Figure 3
Effects of locomotion on cortical responses. A. Spontaneous firing rate during moving versus stationary periods, for narrow- and broad-spiking units. The five units which show negative amplitude in C are denoted by triangles. (N=93 units in 8 animals). B. Peak firing rate in response to drifting gratings during moving versus stationary periods for broad-spiking cells. C. Peak response amplitude for narrow-spiking cells. D. Population medians for spontaneous and evoked firing rates, for broad-spiking units, compared with urethane anesthesia data from Niell & Stryker, 2008. E. Mean orientation selectivity index (OSI) for all broad-spiking cells that responded in both states (n=28 units.) F. Median orientation tuning width for units in D. G. Response amplitude versus speed from 0 to 50cm/sec for all individual trials of the optimal grating stimulus. Amplitude is normalized by average evoked firing rate to the stimulus for each unit. Green line shows median curve. See also Figure S3.
Figure 4
Figure 4
LGN response amplitude does not depend on behavioral state. A) Raster plot for a transient LGN cell, in response to drifting gratings at 2Hz, with individual trials coded as red (stationary) and blue (moving). Burst events are circled in green. Gray bar shows stimulus duration. B,C) Histograms of response during stationary (B) and moving (C) trials. D) Spontaneous rate during stationary versus moving periods. E) Peak F1 response to periodic gratings in both behavioral states. F) Median value across all units for spontaneous rate, and peak F1 and F0 response. (n=46 units, 4 animals). G) Fraction of spikes which occurred during bursts for stationary vs. moving periods. See also Figure S4.

Similar articles

Cited by

References

    1. Bartho P, Hirase H, Monconduit L, Zugaro M, Harris KD, Buzsaki G. Characterization of neocortical principal cells and interneurons by network interactions and extracellular features. J Neurophysiol. 2004;92:600–608. - PubMed
    1. Bezdudnaya T, Cano M, Bereshpolova Y, Stoelzel CR, Alonso JM, Swadlow HA. Thalamic burst mode and inattention in the awake LGNd. Neuron. 2006;49:421–432. - PubMed
    1. Brainard DH. The Psychophysics Toolbox. Spat Vis. 1997;10:433–436. - PubMed
    1. Brecht M, Roth A, Sakmann B. Dynamic receptive fields of reconstructed pyramidal cells in layers 3 and 2 of rat somatosensory barrel cortex. J Physiol. 2003;553:243–265. - PMC - PubMed
    1. Buzsaki G. Theta oscillations in the hippocampus. Neuron. 2002;33:325–340. - PubMed

Publication types