. 2010 Feb 26;37(4):457-68.
doi: 10.1016/j.molcel.2010.01.030.

Neuronal MeCP2 is expressed at near histone-octamer levels and globally alters the chromatin state

Affiliations

Neuronal MeCP2 is expressed at near histone-octamer levels and globally alters the chromatin state

Peter J Skene et al. Mol Cell. .

Abstract

MeCP2 is a nuclear protein with an affinity for methylated DNA that can recruit histone deacetylases. Deficiency or excess of MeCP2 causes severe neurological problems, suggesting that the number of molecules per cell must be precisely regulated. We quantified MeCP2 in neuronal nuclei and found that it is nearly as abundant as the histone octamer. Despite this high abundance, MeCP2 associates preferentially with methylated regions, and high-throughput sequencing showed that its genome-wide binding tracks methyl-CpG density. MeCP2 deficiency results in global changes in neuronal chromatin structure, including elevated histone acetylation and a doubling of histone H1. Neither change is detectable in glia, where MeCP2 occurs at lower levels. The mutant brain also shows elevated transcription of repetitive elements. Our data argue that MeCP2 may not act as a gene-specific transcriptional repressor in neurons, but might instead dampen transcriptional noise genome-wide in a DNA methylation-dependent manner.


Figures

Fig 1
Fig 1
The abundance of MeCP2 in purified neuronal nuclei approaches that of the histone octamer. Nuclei were isolated from wildtype whole mouse brain and then FACS-stained for (A) NeuN and (B) MeCP2. (C) Nuclei sorted for NeuN-negative and NeuN-positive staining co-sorted with low-MeCP2 and high-MeCP2 stained nuclei, respectively. (D) Infra-red western blotting for NeuN, MeCP2 and histone H3 was performed on unsorted and FACS sorted nuclei. The graph indicates quantification of western signals normalised for H3 loading. (E) The level of MeCP2 in unsorted brain nuclei was quantified against recombinant MeCP2 by infra-red western blotting. The graph below indicates densitometric analysis using Licor Odyssey (F) Densitometric analysis of western blots to determine absolute abundance of MeCP2 in the different nuclei populations. The positions of molecular weight markers (kDa) are indicated. Error bars indicate the mean +/− SEM. See also Fig S1.
Fig 2
Fig 2
MeCP2 shows widespread binding across gene loci in mature brain. Mouse tissues (brain, hippocampus, liver) were dissected and ChIP performed using an antibody against MeCP2. Immunoprecipitated DNA was analysed by real time PCR using a panel of primers. (A) ChIP of the major satellite repeat shows 130-fold enrichment in wildtype brain compared to Mecp2-null brain, indicating that the antibody is highly specific. (B) MeCP2 binding profile across 39 kb of the promoter region of Bdnf. The blue vertical lines below the graph indicate CpG sites, with CGIs shaded in light grey. Alternative Bdnf exons 1 are indicated with dark grey rectangles. The asterisk marks the discreet binding site identified using cultured embryonic cortical neurons (Chen et al, 2003). ChIP was performed on various tissues as indicated. (C) MeCP2 ChIP profile across a 40 kb region encompassing the Dlx5/6 locus. The asterisk marks the key site identified using brains of 1 day old mice. Wildtype whole brain is shown in blue and Mecp2-null whole brain is shown in red. (D) MeCP2 binding profile across the c-Myc locus in wildtype (blue) and Mecp2-null (red) brains. (E) MeCP2 binding profile across the Actb locus follows the meCpG density. MeCP2 ChIP was performed on wildtype brain (blue). Total brain genomic DNA was subjected to bisulfite sequencing for a continuous run of 262 CpG sites across ~9 kb. The methylation density is plotted based on a window size of 650 bp and step of 50 bp (shown in black). Error bars indicate mean +/− SEM.
Fig 3
Fig 3
Brain MeCP2 binds selectively to methylated DNA in vivo. Whole mouse brains were dissected and ChIP performed using antibodies against MeCP2 and acetylated histone H3. Input DNA and immunoprecipitated DNA were analysed by real time PCR and subjected to bisulfite sequencing. (A) MeCP2 binding profile across 12 kb of the Xist locus in wildtype male brain (blue), wildtype female brain (pink) and Mecp2-null brain (grey). The blue vertical lines below the graph indicate CpG sites, with the CGI shaded in light grey. The transcription start site is indicated with an arrow. The horizontal black line marks the region amplified for bisulfite sequencing. (B) ChIP was performed on the wildtype female brain for MeCP2 and histone H3 acetylation. Recovered DNA was used for bisulfite sequencing of a region of the Xist promoter. Each line represents a single clone. Open and filled circles indicate non-methylated and methylated CpG sites, respectively. Crosses indicate uncharacterised CpG sites. (C) MeCP2 ChIP profile across 9 kb of the imprinted Snrpn locus in wildtype brain. (D) ChIP was performed on the wildtype brain for MeCP2 and histone H3 acetylation. The resulting DNA was used for bisulfite sequencing of a region of the Snrpn promoter. Error bars indicate mean +/− SEM.
Fig 4
Fig 4
High throughput sequencing of immunoprecipitated chromatin shows MeCP2 globally distributed and tracking the meCpG density. (A) Profiles of MeCP2-bound sequences (blue), CpG density (red) and parallel sequencing from methyl-CpG-rich sequences (green) were analysed using a sliding window (5 kb window; 1 kb step). A 52 Mb region of chromosome 5 is shown. The vertical axis represents sequencing hits or number of CpGs per window. (B) The genome was scanned using a 500 bp window (100 bp step) and the number of MeCP2 hits per window plotted against the number of CpGs per window. Boxplots are shown with the horizontal line indicating the median and the surrounding box showing the interquartile range. The width of the box is proportional to the fraction of the genome that corresponds with that CpG density. The majority of CGIs contain greater than 5 CpG sites/100 bp as indicated by red line, whereas the bulk genome has a lower CpG density. (C) Methylated CGIs were indentified by methyl-CpG affinity chromatography. The surrounding 5 kb of genomic DNA was analyzed for MeCP2 binding using a 500 bp window (100 bp step). Results are presented as for (B). See Fig S2.
Fig 5
Fig 5
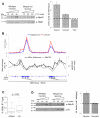
MeCP2-deficiency affects the global chromatin state by elevating levels of histone H3 acetylation (H3Ac) and the linker histone H1. (A) H3Ac levels were determined by western blotting of unsorted brain nuclei and FACS purified nuclei from both wildtype and Mecp2-null brain. The western blot shows H3Ac levels in the neuronal nuclei plus histones from the same samples resolved and stained by coomassie blue as a loading control (lower panel). The graph indicates densitometric analysis of H3Ac levels in the different nuclei populations, normalised for differences in loading. The horizontal line represents no change between wildtype and Mecp2-null. (B) The upper graph shows the H3Ac profile across the promoter region of the Bdnf locus in wildtype (blue) and Mecp2-null (red) brains. The lower graph indicates the H3Ac fold difference between wildtype and MeCP2-null brain (pink); the MeCP2 ChIP profile is also shown (black). The blue vertical lines below the graph indicate CpG sites, with the CGI shaded in light grey. The gene structure is indicated by dark grey rectangles below. This data represents the average of 3 independent experiments. (C) Boxplot showing all H3Ac ChIP results for wildtype and Mecp2-null brain (n=100). (D) Quantitative western blotting for histone H1 and NeuN (as a loading control) using FACS purified neuronal nuclei from wildtype and Mecp2-null mice. The graph indicates densitometric analysis of H1 levels in the different nuclei populations. Error bars indicate mean +/− SEM and the KS test was used to determine statistical significance. See also Fig S3.
Fig 6
Fig 6
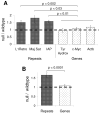
MeCP2 suppresses transcription from repetitive elements distributed throughout the genome. Nuclei were isolated from wildtype and Mecp2-null brains. RNA was extracted and cDNA was prepared, with and without reverse transcriptase. (A) Quantitative PCR was used to determine the expression levels of repetitive regions and genic regions. The data was normalised to GAPDH and shown as a ratio between Mecp2-null and wildtype nuclei. The horizontal line represents no change between wildtype and Mecp2-null mice. (B) Shows the pooled data, grouping repetitive regions and genic regions. Error bars indicate SEM +/− mean. The KS test was used to determine statistical significance. See Fig S4.

Comment in

Similar articles

Cited by

References

    1. Allan J, Rau DC, Harborne N, Gould H. Higher order structure in a short repeat length chromatin. J Cell Biol. 1984;98:1320–1327. - PMC - PubMed
    1. Amir RE, Van den Veyver IB, Wan M, Tran CQ, Francke U, Zoghbi HY. Rett syndrome is caused by mutations in X-linked MECP2, encoding methyl-CpG-binding protein 2. Nat Genet. 1999;23:185–188. - PubMed
    1. Armstrong DD. Neuropathology of Rett syndrome. Ment Retard Dev Disabil Res Rev. 2002;8:72–76. - PubMed
    1. Bading H. Transcription-dependent neuronal plasticity the nuclear calcium hypothesis. Eur J Biochem. 2000;267:5280–5283. - PubMed
    1. Ballas N, Lioy DT, Grunseich C, Mandel G. Non-cell autonomous influence of MeCP2-deficient glia on neuronal dendritic morphology. Nat Neurosci. 2009;12:311–317. - PMC - PubMed

Publication types

Associated data