

Application of the Amplex red/horseradish peroxidase assay to measure hydrogen peroxide generation by recombinant microsomal enzymes
- PMID: 20188819
- PMCID: PMC3643635
- DOI: 10.1016/j.freeradbiomed.2010.02.030
Application of the Amplex red/horseradish peroxidase assay to measure hydrogen peroxide generation by recombinant microsomal enzymes
Abstract
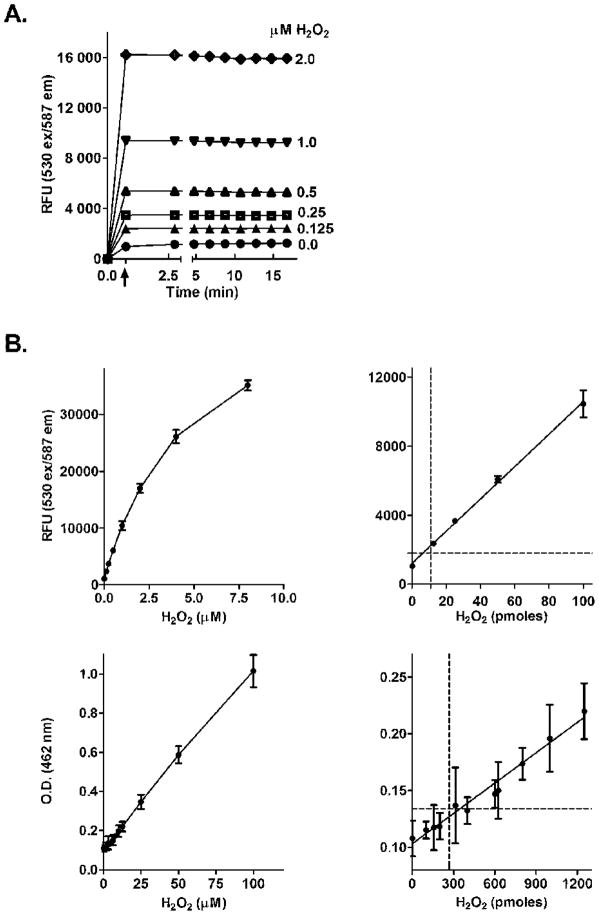
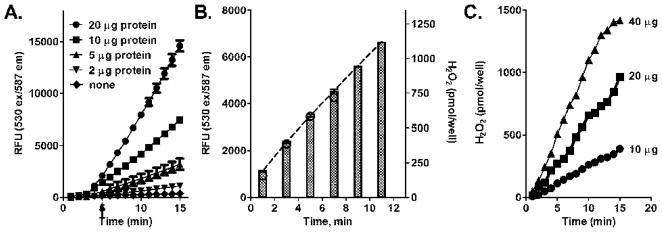
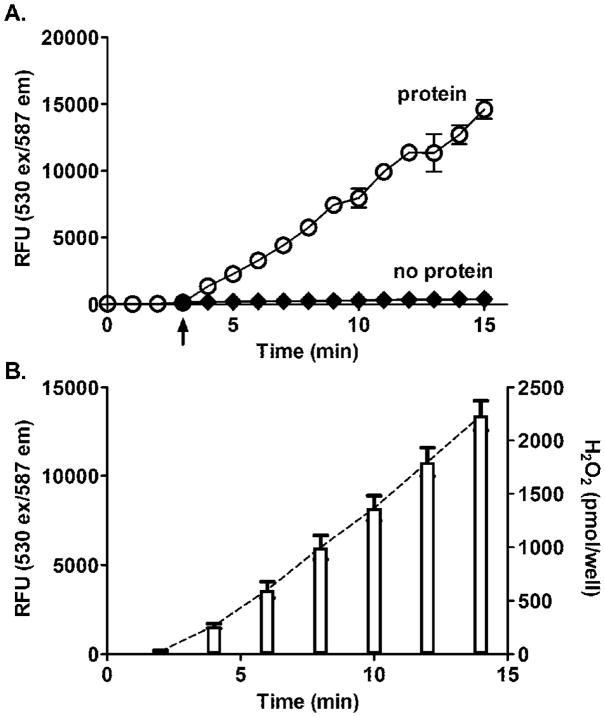
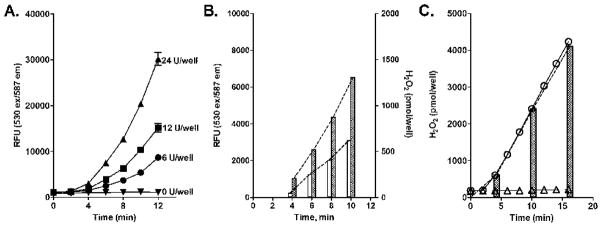
The formation of reactive oxygen species by the cytochrome P450 monooxygenase system is thought to be due to autoxidation of NADPH-cytochrome P450 reductase and the nonproductive decay of oxygen-bound cytochrome P450 intermediates. To characterize this process in recombinant microsomal enzymes, we used a highly sensitive hydrogen peroxide assay based on Amplex red oxidation. This assay is 20 times more sensitive (LLD=5.0pmol/assay and LLQ=30pmol/assay) than the standard ferrous thiocyanate assay for detection of hydrogen peroxide. We found low, but detectable, spontaneous generation of hydrogen peroxide by recombinant human NADPH-cytochrome P450 reductase complexes (0.09nmol hydrogen peroxide/min/100Units of NADPH-cytochrome P450 reductase). Significantly higher rates of hydrogen peroxide production were observed when recombinant cytochrome P450 enzymes were coexpressed with NADPH-cytochrome P450 reductase (0.31nmol of hydrogen peroxide/min/100Units of NADPH-cytochrome P450 reductase). This was independent of the addition of any exogenous cytochrome P450 substrates. These data demonstrate that cytochrome P450s are a major source of hydrogen peroxide in the recombinant cytochrome P450 monooxygenase system. Moreover, substrate binding is not required for the cytochrome P450s to generate reactive oxygen species.
Copyright 2010 Elsevier Inc. All rights reserved.
Figures
Similar articles
-
The amplex red/horseradish peroxidase assay requires superoxide dismutase to measure hydrogen peroxide in the presence of NAD(P)H.Free Radic Res. 2020 Sep;54(8-9):620-628. doi: 10.1080/10715762.2020.1821883. Epub 2020 Oct 9. Free Radic Res. 2020. PMID: 32912004 Free PMC article.
-
Human recombinant cytochrome P450 enzymes display distinct hydrogen peroxide generating activities during substrate independent NADPH oxidase reactions.Toxicol Sci. 2014 Oct;141(2):344-52. doi: 10.1093/toxsci/kfu133. Epub 2014 Jul 24. Toxicol Sci. 2014. PMID: 25061110 Free PMC article.
-
Redox cycling of resorufin catalyzed by rat liver microsomal NADPH-cytochrome P450 reductase.Arch Biochem Biophys. 1989 Feb 1;268(2):605-16. doi: 10.1016/0003-9861(89)90328-7. Arch Biochem Biophys. 1989. PMID: 2464338
-
Organization of multiple cytochrome P450s with NADPH-cytochrome P450 reductase in membranes.Pharmacol Ther. 2003 May;98(2):221-33. doi: 10.1016/s0163-7258(03)00031-7. Pharmacol Ther. 2003. PMID: 12725870 Review.
-
P450BM-3; a tale of two domains--or is it three?Steroids. 1997 Jan;62(1):117-23. doi: 10.1016/s0039-128x(96)00169-9. Steroids. 1997. PMID: 9029725 Review.
Cited by
-
Lipoprotein redox status evaluation as a marker of cardiovascular disease risk in patients with inflammatory disease.Mol Med Rep. 2017 Jan;15(1):256-262. doi: 10.3892/mmr.2016.5972. Epub 2016 Nov 28. Mol Med Rep. 2017. PMID: 27909725 Free PMC article.
-
Direct and rapid measurement of hydrogen peroxide in human blood using a microfluidic device.Sci Rep. 2021 Feb 3;11(1):2960. doi: 10.1038/s41598-021-82623-4. Sci Rep. 2021. PMID: 33536535 Free PMC article.
-
Measuring reactive oxygen and nitrogen species with fluorescent probes: challenges and limitations.Free Radic Biol Med. 2012 Jan 1;52(1):1-6. doi: 10.1016/j.freeradbiomed.2011.09.030. Epub 2011 Oct 2. Free Radic Biol Med. 2012. PMID: 22027063 Free PMC article. Review.
-
β-Deuterium Isotope Effects on Firefly Luciferase Bioluminescence.ChemistryOpen. 2017 Sep 6;6(6):697-700. doi: 10.1002/open.201700136. eCollection 2017 Dec. ChemistryOpen. 2017. PMID: 29226056 Free PMC article.
-
The amplex red/horseradish peroxidase assay requires superoxide dismutase to measure hydrogen peroxide in the presence of NAD(P)H.Free Radic Res. 2020 Sep;54(8-9):620-628. doi: 10.1080/10715762.2020.1821883. Epub 2020 Oct 9. Free Radic Res. 2020. PMID: 32912004 Free PMC article.
References
-
- Ortiz de Montellano PR. Cytochrome P450: structure, mechanism, and biochemistry. 3. Kluwer/Plenum; New York: 2005.
-
- Guengerich FP. Cytochrome P450 and chemical toxicology. Chem Res Toxicol. 2008;21:70–83. - PubMed
-
- Hlavica P, Schulze J, Lewis DF. Functional interaction of cytochrome P450 with its redox partners: a critical assessment and update of the topology of predicted contact regions. J Inorg Biochem. 2003;96:279–297. - PubMed
-
- Coon MJ. Cytochrome P450: nature’s most versatile biological catalyst. Annu Rev Pharmacol Toxicol. 2005;45:1–25. - PubMed
-
- Poulos TL. Intermediates in P450 catalysis. Philos Transact A Math Phys Eng Sci. 2005;363:793–806. - PubMed
Publication types
MeSH terms
Substances
Grants and funding
- R01 CA132624/CA/NCI NIH HHS/United States
- CA132624/CA/NCI NIH HHS/United States
- P30 CA072720/CA/NCI NIH HHS/United States
- P30 ES005022/ES/NIEHS NIH HHS/United States
- R01 CA100994/CA/NCI NIH HHS/United States
- CA093798/CA/NCI NIH HHS/United States
- R01 CA093798/CA/NCI NIH HHS/United States
- U54 AR055073/AR/NIAMS NIH HHS/United States
- ES005022/ES/NIEHS NIH HHS/United States
- GM034310/GM/NIGMS NIH HHS/United States
- P41 RR001395/RR/NCRR NIH HHS/United States
- AR055073/AR/NIAMS NIH HHS/United States
- R01 GM034310/GM/NIGMS NIH HHS/United States
- CA100994/CA/NCI NIH HHS/United States
- ES004738/ES/NIEHS NIH HHS/United States
- U54AR055073/AR/NIAMS NIH HHS/United States
- R01 ES004738/ES/NIEHS NIH HHS/United States
- R55 CA093798/CA/NCI NIH HHS/United States
LinkOut - more resources
Full Text Sources
Other Literature Sources
