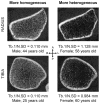
Regional variations of gender-specific and age-related differences in trabecular bone structure of the distal radius and tibia
- PMID: 20188877
- PMCID: PMC2875319
- DOI: 10.1016/j.bone.2010.02.021
Regional variations of gender-specific and age-related differences in trabecular bone structure of the distal radius and tibia
Abstract
Regional variation in trabecular structure across axial sections is often obscured by the conventional global analysis, which takes an average value for the entire trabecular compartment. The objective of this study is to characterize spatial variability in trabecular structure within a cross-section at the distal radius and tibia, and gender and age effects using in vivo high-resolution peripheral quantitative computed tomography (HR-pQCT). HR-pQCT images of the distal radius and tibia were acquired from 146 healthy individuals aged 20-78 years. Trabecular bone volume fraction (BV/TV), number (Tb.N), thickness (Tb.Th), separation (Tb.Sp), and heterogeneity (Tb.1/N.SD) were obtained in a total of 11 regions-the entire trabecular compartment (the global means), inner, outer, and eight defined subregions. Regional variations were examined with respect to the global means, and compared between women and men, and between young (20-29 years old) and elderly (65-79 years old) adults. Substantial regional variations in trabecular bone structure at the distal radius and tibia were revealed (e.g. BV/TV varied -40% to +57% and -59% to +100% of the global means, respectively, for elderly women). The inner-lateral (IL) subregion had low BV/TV, Tb.N, and Tb.Th, and low Tb.Sp and Tb.1/N.SD at both sites; the opposite was true in the outer-anterior (OA) subregion at the distal radius and the outer-medial (OM) and -posterior (OP) subregions at the distal tibia. Gender differences were most pronounced in the inner-anterior (IA) subregion compared to the other regions or the global mean differences at both sites. Trabecular structure associated with age and differed between young and elderly adults predominantly in the inner-posterior (IP) subregion at the distal radius and in the IL and IA subregions at the distal tibia; on the other hand, it remained unchanged in the OA subregion at the distal radius and in the OM subregion at the distal tibia for both women and men. This study demonstrated that not only the conventional global analysis can obscure regional differences, but also assuming bone status from that of smaller subregion may introduce a confounding sampling error. Therefore, a combined approach of investigating the entire region, each subregion, and the cortical compartment may offer more complete information.
Copyright 2010 Elsevier Inc. All rights reserved.
Figures


Similar articles
-
Age- and gender-related differences in cortical geometry and microstructure: Improved sensitivity by regional analysis.Bone. 2013 Feb;52(2):623-31. doi: 10.1016/j.bone.2012.10.031. Epub 2012 Nov 7. Bone. 2013. PMID: 23142360 Free PMC article.
-
Age-related reference curves of volumetric bone density, structure, and biomechanical parameters adjusted for weight and height in a population of healthy women: an HR-pQCT study.Osteoporos Int. 2017 Apr;28(4):1335-1346. doi: 10.1007/s00198-016-3876-0. Epub 2016 Dec 15. Osteoporos Int. 2017. PMID: 27981337
-
High-resolution peripheral quantitative computed tomography can assess microstructural and mechanical properties of human distal tibial bone.J Bone Miner Res. 2010 Apr;25(4):746-56. doi: 10.1359/jbmr.090822. J Bone Miner Res. 2010. PMID: 19775199 Free PMC article.
-
Current Physical Activity Is Independently Associated With Cortical Bone Size and Bone Strength in Elderly Swedish Women.J Bone Miner Res. 2017 Mar;32(3):473-485. doi: 10.1002/jbmr.3006. Epub 2016 Oct 24. J Bone Miner Res. 2017. PMID: 27676223
-
Characterising variability and regional correlations of microstructure and mechanical competence of human tibial trabecular bone: An in-vivo HR-pQCT study.Bone. 2019 Apr;121:139-148. doi: 10.1016/j.bone.2019.01.013. Epub 2019 Jan 15. Bone. 2019. PMID: 30658093
Cited by
-
Age- and gender-related differences in cortical geometry and microstructure: Improved sensitivity by regional analysis.Bone. 2013 Feb;52(2):623-31. doi: 10.1016/j.bone.2012.10.031. Epub 2012 Nov 7. Bone. 2013. PMID: 23142360 Free PMC article.
-
Mechanical loading causes detectable changes in morphometric measures of trabecular structure in human cancellous bone.J Biomech Eng. 2013 May;135(5):54505. doi: 10.1115/1.4024136. J Biomech Eng. 2013. PMID: 24231966 Free PMC article.
-
A Trimodality Comparison of Volumetric Bone Imaging Technologies. Part II: 1-Yr Change, Long-Term Precision, and Least Significant Change.J Clin Densitom. 2015 Apr-Jun;18(2):260-9. doi: 10.1016/j.jocd.2014.07.004. Epub 2014 Aug 13. J Clin Densitom. 2015. PMID: 25129406 Free PMC article.
-
Noninvasive imaging of bone microarchitecture.Ann N Y Acad Sci. 2011 Dec;1240:77-87. doi: 10.1111/j.1749-6632.2011.06282.x. Ann N Y Acad Sci. 2011. PMID: 22172043 Free PMC article. Review.
-
High-impact exercise stimulated localised adaptation of microarchitecture across distal tibia in postmenopausal women.Osteoporos Int. 2021 May;32(5):907-919. doi: 10.1007/s00198-020-05714-4. Epub 2020 Nov 16. Osteoporos Int. 2021. PMID: 33196852 Clinical Trial.
References
-
- Osteoporosis prevention, diagnosis, and therapy. NIH Consens Statement. 2000;17:1–45. - PubMed
-
- MacNeil JA, Boyd SK. Accuracy of high-resolution peripheral quantitative computed tomography for measurement of bone quality. Med Eng Phys. 2007;29:1096–105. - PubMed
-
- MacNeil JA, Boyd SK. Load distribution and the predictive power of morphological indices in the distal radius and tibia by high resolution peripheral quantitative computed tomography. Bone. 2007;41:129–37. - PubMed
Publication types
MeSH terms
Grants and funding
LinkOut - more resources
Full Text Sources
Miscellaneous

