

Risk implications of the new CKD Epidemiology Collaboration (CKD-EPI) equation compared with the MDRD Study equation for estimated GFR: the Atherosclerosis Risk in Communities (ARIC) Study
- PMID: 20189275
- PMCID: PMC2858455
- DOI: 10.1053/j.ajkd.2009.12.016
Risk implications of the new CKD Epidemiology Collaboration (CKD-EPI) equation compared with the MDRD Study equation for estimated GFR: the Atherosclerosis Risk in Communities (ARIC) Study
Abstract
Background: The Chronic Kidney Disease Epidemiology Collaboration (CKD-EPI) recently published an equation for estimated glomerular filtration rate (eGFR) using the same variables (serum creatinine level, age, sex, and race) as the Modification of Diet in Renal Disease (MDRD) Study equation. Although the CKD-EPI equation estimates GFR more precisely compared with the MDRD Study equation, whether this equation improves risk prediction is unknown.
Study design: Prospective cohort study, the Atherosclerosis Risk in Communities (ARIC) Study.
Setting & participants: 13,905 middle-aged participants without a history of cardiovascular disease with median follow-up of 16.9 years.
Predictor: eGFR.
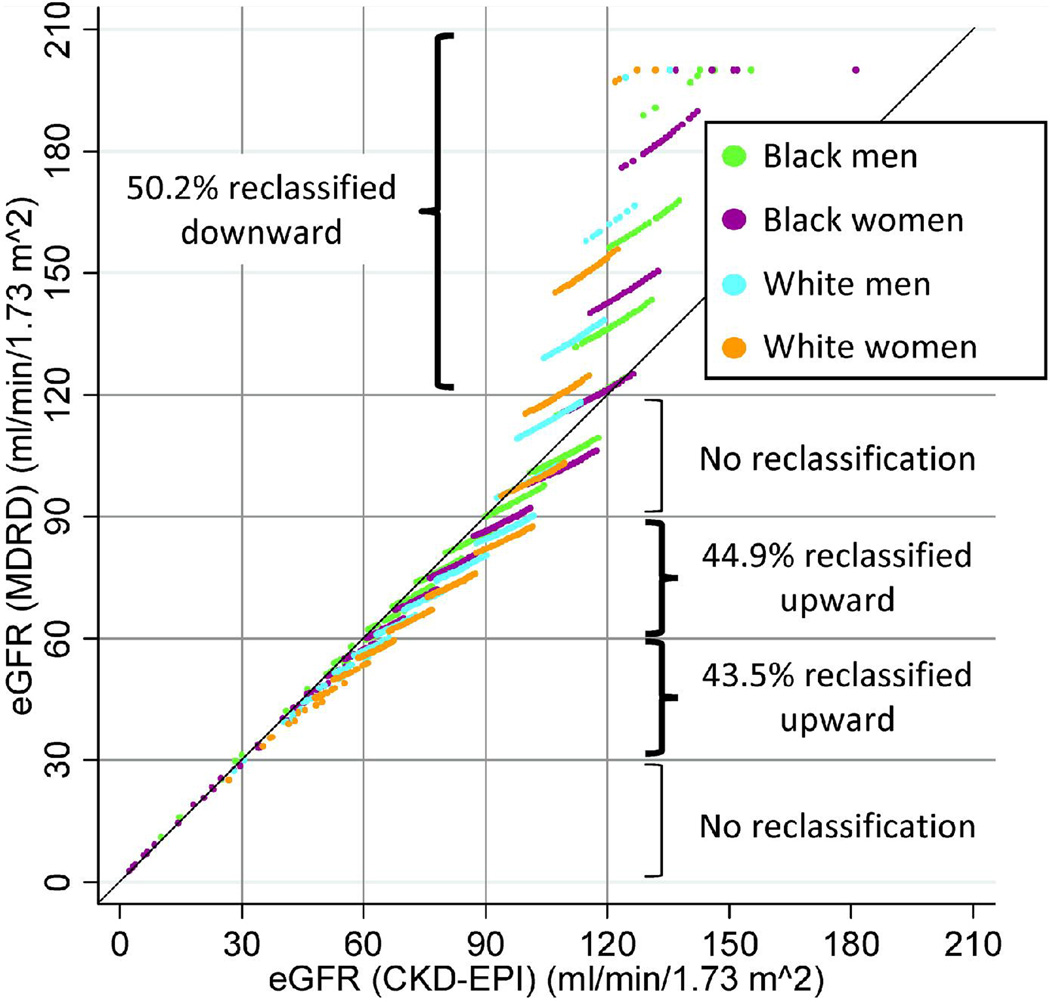
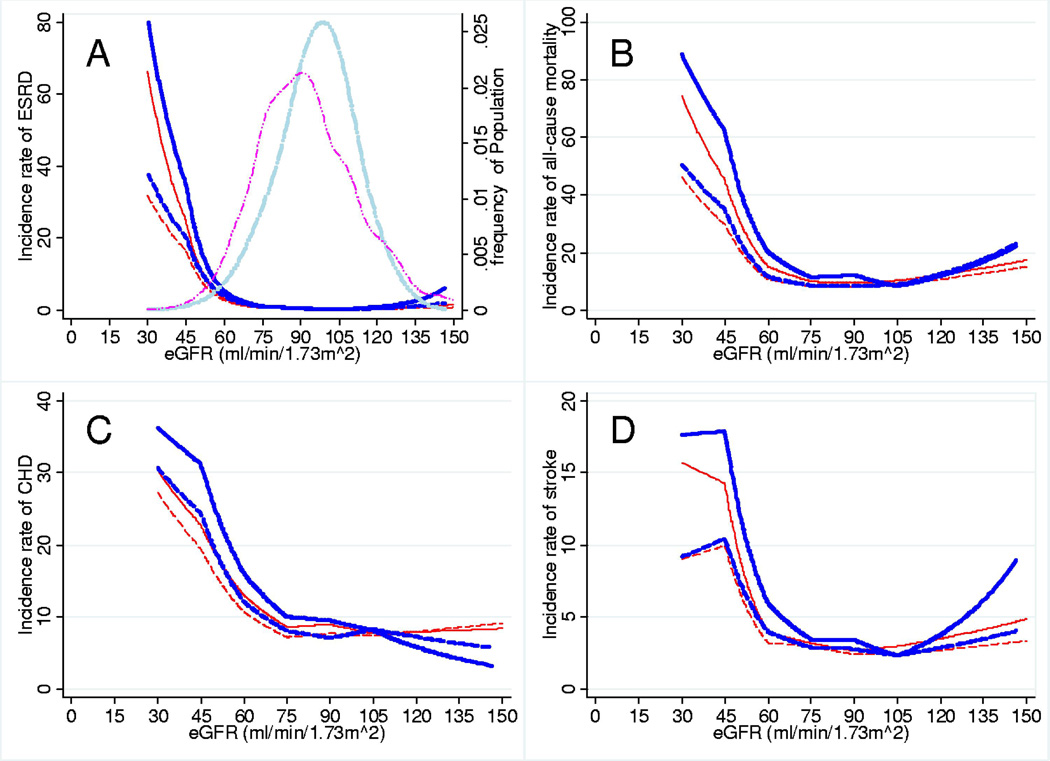
Outcomes & measurements: We compared the association of eGFR in categories (>or=120, 90-119, 60-89, 30-59, and <30 mL/min/1.73 m(2)) using the CKD-EPI and MDRD Study equations with risk of incident end-stage renal disease, all-cause mortality, coronary heart disease, and stroke.
Results: The median value for eGFR(CKD-EPI) was higher than that for eGFR(MDRD) (97.6 vs 88.8 mL/min/1.73 m(2); P < 0.001). The CKD-EPI equation reclassified 44.9% (n = 3,079) and 43.5% (n = 151) of participants with eGFR(MDRD) of 60-89 and 30-59 mL/min/1.73 m(2), respectively, upward to a higher eGFR category, but reclassified no one with eGFR(MDRD) of 90-119 or <30 mL/min/1.73 m(2), decreasing the prevalence of CKD stages 3-5 from 2.7% to 1.6%. Participants with eGFR(MDRD) of 30-59 mL/min/1.73 m(2) who were reclassified upward had lower risk compared with those who were not reclassified (end-stage renal disease incidence rate ratio, 0.10 [95% CI, 0.03-0.33]; all-cause mortality, 0.30 [95% CI, 0.19-0.48]; coronary heart disease, 0.36 [95% CI, 0.21-0.61]; and stroke, 0.50 [95% CI, 0.24-1.02]). Similar results were observed for participants with eGFR(MDRD) of 60-89 mL/min/1.73 m(2). More frequent reclassification of younger, female, and white participants explained some of these trends. Net reclassification improvement in participants with eGFR < 120 mL/min/1.73 m(2) was positive for all outcomes (P < 0.001).
Limitations: Limited number of cases with eGFR < 60 mL/min/1.73 m(2) and no measurement of albuminuria.
Conclusions: The CKD-EPI equation more appropriately categorized individuals with respect to long-term clinical risk compared with the MDRD Study equation, suggesting improved clinical usefulness in this middle-aged population.
Copyright 2010 National Kidney Foundation, Inc. Published by Elsevier Inc. All rights reserved.
Figures
Comment in
-
Estimating GFR using the CKD Epidemiology Collaboration (CKD-EPI) creatinine equation: more accurate GFR estimates, lower CKD prevalence estimates, and better risk predictions.Am J Kidney Dis. 2010 Apr;55(4):622-7. doi: 10.1053/j.ajkd.2010.02.337. Am J Kidney Dis. 2010. PMID: 20338463 Free PMC article. No abstract available.
References
-
- Vassalotti JA, Stevens LA, Levey AS. Testing for chronic kidney disease: a position statement from the National Kidney Foundation. Am J Kidney Dis. 2007;50(2):169–180. - PubMed
-
- National Kidney Foundation. K/DOQI clinical practice guidelines for chronic kidney disease: evaluation, classification, and stratification. Am J Kidney Dis. 2002;39(2 Suppl 1):S1–S266. - PubMed
-
- The National Institute for Health and Clinical Excellence. Chronic kidney disease: early identification and management of chronic kidney disease in adults in primary and secondary care. [Accessed July 27th, 2009]. http://www.nice.org.uk/nicemedia/pdf/CG073NICEGuideline.pdf. - PubMed
-
- Sarnak MJ, Levey AS, Schoolwerth AC, et al. Kidney disease as a risk factor for development of cardiovascular disease: a statement from the American Heart Association Councils on Kidney in Cardiovascular Disease, High Blood Pressure Research, Clinical Cardiology, and Epidemiology and Prevention. Circulation. 2003;108(17):2154–2169. - PubMed
Publication types
MeSH terms
Grants and funding
- N01 HC055022/HC/NHLBI NIH HHS/United States
- N01 HC055016/HL/NHLBI NIH HHS/United States
- N01 HC055019/HL/NHLBI NIH HHS/United States
- N01-HC-55016/HC/NHLBI NIH HHS/United States
- N01 HC055018/HC/NHLBI NIH HHS/United States
- N01-HC-55021/HC/NHLBI NIH HHS/United States
- N01-HC-55015/HC/NHLBI NIH HHS/United States
- N01-HC-55020/HC/NHLBI NIH HHS/United States
- K01DK076595/DK/NIDDK NIH HHS/United States
- N01 HC055016/HC/NHLBI NIH HHS/United States
- N01-HC-55022/HC/NHLBI NIH HHS/United States
- N01 HC055021/HL/NHLBI NIH HHS/United States
- T32 HL007024/HL/NHLBI NIH HHS/United States
- N01 HC055015/HL/NHLBI NIH HHS/United States
- N01 HC055020/HL/NHLBI NIH HHS/United States
- K01 DK076595/DK/NIDDK NIH HHS/United States
- N01 HC055019/HC/NHLBI NIH HHS/United States
- N01-HC-55019/HC/NHLBI NIH HHS/United States
- R01DK076770/DK/NIDDK NIH HHS/United States
- R01 DK076770/DK/NIDDK NIH HHS/United States
- N01 HC055015/HC/NHLBI NIH HHS/United States
- N01 HC055021/HC/NHLBI NIH HHS/United States
- N01 HC055018/HL/NHLBI NIH HHS/United States
- N01 HC055022/HL/NHLBI NIH HHS/United States
- N01 HC055020/HC/NHLBI NIH HHS/United States
- N01-HC-55018/HC/NHLBI NIH HHS/United States
- T32HL07024/HL/NHLBI NIH HHS/United States
LinkOut - more resources
Full Text Sources
Medical
Research Materials
Miscellaneous
