Metabolomic characterization of the salt stress response in Streptomyces coelicolor
- PMID: 20190082
- PMCID: PMC2849216
- DOI: 10.1128/AEM.01992-09
Metabolomic characterization of the salt stress response in Streptomyces coelicolor
Abstract
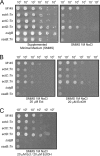
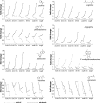
The humicolous actinomycete Streptomyces coelicolor routinely adapts to a wide variety of habitats and rapidly changing environments. Upon salt stress, the organism is also known to increase the levels of various compatible solutes. Here we report the results of the first high-resolution metabolomics time series analysis of various strains of S. coelicolor exposed to salt stress: the wild type, mutants with progressive knockouts of the ectoine biosynthesis pathway, and two stress regulator mutants (with disruptions of the sigB and osaB genes). Samples were taken from cultures at 0, 4, 8, and 24 h after salt stress treatment and analyzed by liquid chromatography-mass spectrometry with an LTQ Orbitrap XL mass spectrometer. The results suggest that a large fraction of amino acids is upregulated in response to the salt stress, as are proline/glycine-containing di- and tripeptides. Additionally we found that 5'-methylthioadenosine, a known inhibitor of polyamine biosynthesis, is downregulated upon salt stress. Strikingly, no major differences between the wild-type cultures and the two stress regulator mutants were found, indicating a considerable robustness of the metabolomic response to salt stress, compared to the more volatile changes in transcript abundance reported earlier.
Figures


Similar articles
-
Synthesis and uptake of the compatible solutes ectoine and 5-hydroxyectoine by Streptomyces coelicolor A3(2) in response to salt and heat stresses.Appl Environ Microbiol. 2008 Dec;74(23):7286-96. doi: 10.1128/AEM.00768-08. Epub 2008 Oct 10. Appl Environ Microbiol. 2008. PMID: 18849444 Free PMC article.
-
Diversity of the ectoines biosynthesis genes in the salt tolerant Streptomyces and evidence for inductive effect of ectoines on their accumulation.Microbiol Res. 2014 Sep-Oct;169(9-10):699-708. doi: 10.1016/j.micres.2014.02.005. Epub 2014 Feb 23. Microbiol Res. 2014. PMID: 24629523
-
GlnR-Mediated Regulation of ectABCD Transcription Expands the Role of the GlnR Regulon to Osmotic Stress Management.J Bacteriol. 2015 Oct;197(19):3041-7. doi: 10.1128/JB.00185-15. Epub 2015 Jul 13. J Bacteriol. 2015. PMID: 26170409 Free PMC article.
-
Microbial production of ectoine and hydroxyectoine as high-value chemicals.Microb Cell Fact. 2021 Mar 26;20(1):76. doi: 10.1186/s12934-021-01567-6. Microb Cell Fact. 2021. PMID: 33771157 Free PMC article. Review.
-
Molecular biology of cyanobacterial salt acclimation.FEMS Microbiol Rev. 2011 Jan;35(1):87-123. doi: 10.1111/j.1574-6976.2010.00234.x. FEMS Microbiol Rev. 2011. PMID: 20618868 Review.
Cited by
-
Bridging the gap between fluxomics and industrial biotechnology.J Biomed Biotechnol. 2010;2010:460717. doi: 10.1155/2010/460717. Epub 2011 Jan 2. J Biomed Biotechnol. 2010. PMID: 21274256 Free PMC article. Review.
-
Research progress on GlnR-mediated regulation in Actinomycetes.Front Microbiol. 2023 Nov 22;14:1282523. doi: 10.3389/fmicb.2023.1282523. eCollection 2023. Front Microbiol. 2023. PMID: 38075861 Free PMC article. Review.
-
The oxidative stress and metabolic response of Acinetobacter baumannii for aPDT multiple photosensitization.Sci Rep. 2022 Feb 3;12(1):1913. doi: 10.1038/s41598-022-05650-9. Sci Rep. 2022. PMID: 35115588 Free PMC article.
-
Combining metabolomics and network analysis to improve tacrolimus production in Streptomyces tsukubaensis using different exogenous feedings.J Ind Microbiol Biotechnol. 2017 Nov;44(11):1527-1540. doi: 10.1007/s10295-017-1974-4. Epub 2017 Aug 3. J Ind Microbiol Biotechnol. 2017. PMID: 28776273
-
Transcriptome and metabolome profiling unveils the mechanisms of naphthalene acetic acid in promoting cordycepin synthesis in Cordyceps militaris.Front Nutr. 2023 Feb 16;10:1104446. doi: 10.3389/fnut.2023.1104446. eCollection 2023. Front Nutr. 2023. PMID: 36875834 Free PMC article.
References
-
- Amezaga, M. R., I. Davidson, D. McLaggan, A. Verheul, T. Abee, and I. R. Booth. 1995. The role of peptide metabolism in the growth of Listeria monocytogenes ATCC 23074 at high osmolarity. Microbiology 141:41-49. - PubMed
-
- Bentley, S. D., K. F. Chater, A. M. Cerdeno-Tarraga, G. L. Challis, N. R. Thomson, K. D. James, D. E. Harris, M. A. Quail, H. Kieser, D. Harper, A. Bateman, S. Brown, G. Chandra, C. W. Chen, M. Collins, A. Cronin, A. Fraser, A. Goble, J. Hidalgo, T. Hornsby, S. Howarth, C. H. Huang, T. Kieser, L. Larke, L. Murphy, K. Oliver, S. O'Neil, E. Rabbinowitsch, M. A. Rajandream, K. Rutherford, S. Rutter, K. Seeger, D. Saunders, S. Sharp, R. Squares, S. Squares, K. Taylor, T. Warren, A. Wietzorrek, J. Woodward, B. G. Barrell, J. Parkhill, and D. A. Hopwood. 2002. Complete genome sequence of the model actinomycete Streptomyces coelicolor A3(2). Nature 417:141-147. - PubMed
-
- Breitling, R., A. R. Pitt, and M. P. Barrett. 2006. Precision mapping of the metabolome. Trends Biotechnol. 24:543-548. - PubMed
Publication types
MeSH terms
Substances
LinkOut - more resources
Full Text Sources
Other Literature Sources

