. 2010 Apr 29;115(17):3508-19.
doi: 10.1182/blood-2009-09-241398. Epub 2010 Feb 26.

IL-7 and IL-21 are superior to IL-2 and IL-15 in promoting human T cell-mediated rejection of systemic lymphoma in immunodeficient mice

Affiliations

IL-7 and IL-21 are superior to IL-2 and IL-15 in promoting human T cell-mediated rejection of systemic lymphoma in immunodeficient mice

John C Markley et al. Blood. .

Abstract

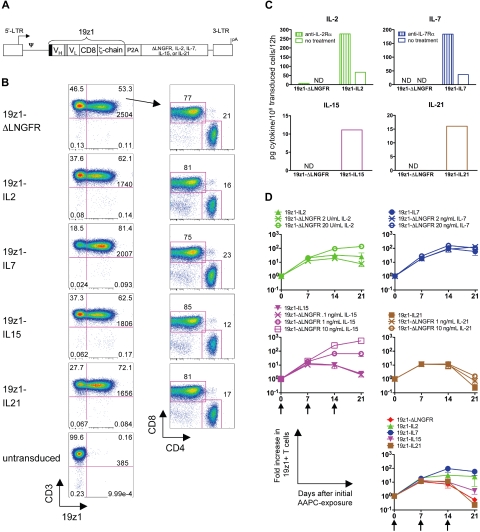
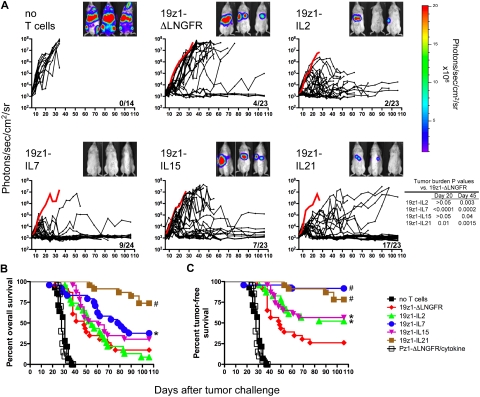
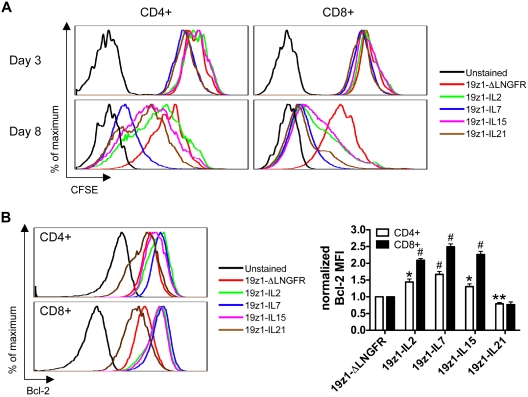
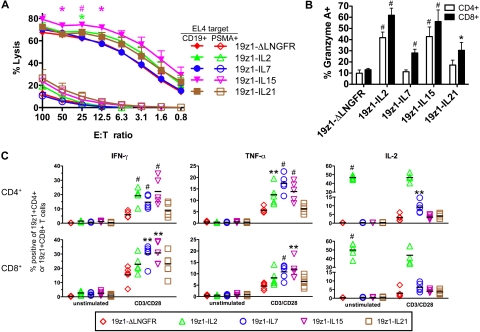
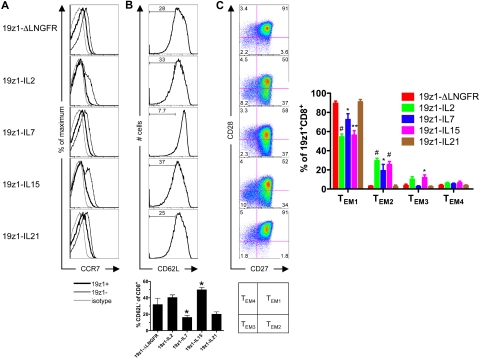
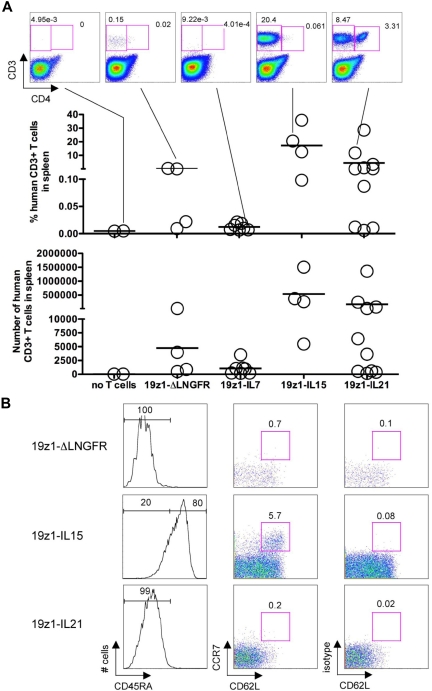
The gamma(c)-cytokines are critical regulators of immunity and possess both overlapping and distinctive functions. However, comparative studies of their pleiotropic effects on human T cell-mediated tumor rejection are lacking. In a xenogeneic adoptive transfer model, we have compared the therapeutic potency of CD19-specific human primary T cells that constitutively express interleukin-2 (IL-2), IL-7, IL-15, or IL-21. We demonstrate that each cytokine enhanced the eradication of systemic CD19(+) B-cell malignancies in nonobese diabetic/severe combined immunodeficient (NOD/SCID)/gamma(c)(null) mice with markedly different efficacies and through singularly distinct mechanisms. IL-7- and IL-21-transduced T cells were most efficacious in vivo, although their effector functions were not as enhanced as IL-2- and IL-15-transduced T cells. IL-7 best sustained in vitro T-cell accumulation in response to repeated antigenic stimulation, but did not promote long-term T-cell persistence in vivo. Both IL-15 and IL-21 overexpression supported long-term T-cell persistence in treated mice, however, the memory T cells found 100 days after adoptive transfer were phenotypically dissimilar, resembling central memory and effector memory T cells, respectively. These results support the use of gamma(c)-cytokines in cancer immunotherapy, and establish that there exists more than 1 human T-cell memory phenotype associated with long-term tumor immunity.


Figures

Figure 1
Figure 1
Retroviral vector design and expression of 19z1 and cytokine transgenes in human primary T cells. (A) Schematic diagram of bicistronic oncoretroviral vectors used for 19z1 and cytokine overexpression. 19z1 indicates human CD19-specific chimeric antigen receptor; black box, CD8 leader sequence; VH, variable heavy chain; gray box, (Gly3Ser)4 linker; VL, variable light chain; CD8, CD8 hinge and transmembrane domains; ζ-chain, TCR ζ-chain cytoplasmic domain; P2A, porcine teschovirus-1–derived 2A peptide; ΔLNGFR, doubly mutated human low-affinity nerve growth factor receptor; LTR, long terminal repeat; ψ, packaging signal; and pA, polyadenylation signal. (B) Cell surface expression of 19z1, CD3, CD4, and CD8 by transduced T cells 6 days after AAPC stimulation. Numbers at the bottom of the upper right quadrant represent the 19z1 MFI of the CD3+19z1+ subset. CD4/CD8 dot plots have been gated on the CD3+19z1+ subset. Dot plots are representative of 8 to 10 experiments using 6 different donors. (C) Secretion of IL-2, IL-7, IL-15, or IL-21 by transduced T cells. Equivalent numbers of 19z1+ T cells were washed and cultured in the presence or absence of an antireceptor blocking antibody. Culture supernatants were assayed for cytokine content by ELISA 12 hours later. Data shown are the average of 2 donors. ND indicates below limit of detection. (D) Overall accumulation of transduced T cells in response to tumor antigen exposure. T cells were transduced and exposed weekly to AAPCs. In parallel, control 19z1-ΔLNGFR T cells were cultured with titrating amounts of exogenously added IL-2, IL-7, IL-15, or IL-21. The number of viable 19z1+ T cells was assessed at the indicated time points. Arrows denote AAPC restimulation. The bottom right graph represents an overlay of the accumulation of cytokine-transduced T cells. Data are average (± SEM) of 3 donors.
Figure 2
Figure 2
Differential in vivo antitumor potency of tumor-specific human primary T cells overexpressing IL-2, IL-7, IL-15, or IL-21. NOD/SCID/γcnull mice were inoculated with 5 × 10⁵ Raji-GL tumor cells and 6 days later received adoptive transfer of 2 × 10⁵ 19z1+CD8+ T cells transduced with 19z1-ΔLNGFR (n = 23), 19z1-IL2 (n = 23), 19z1-IL7 (n = 24), 19z1-IL15 (n = 23), 19z1-IL21 (n = 23), or no T cells (n = 14). As nonspecific controls, mice received T cells transduced with Pz1-ΔLNGFR, Pz1-IL2, Pz1-IL7, Pz1-IL15, or Pz1-IL21 vectors (n = 4 each). The percentage of 19z1+ T cells for each of the 3 experiments at the time of adoptive transfer was as follows: 19z1-ΔLNGFR: 53, 71, 61 (mean, 62); 19z1-IL2: 62, 64, 72 (mean, 66); 19z1-IL7: 81, 92, 85 (mean, 86); 19z1-IL15: 63, 68, 72 (mean, 68); and 19z1-IL21: 72, 78, 76 (mean, 75). (A) Quantified tumor burden measured by in vivo bioluminescent imaging. Immediately prior to T-cell injection, biweekly until day 55, and weekly thereafter, mice were anesthetized and administered intraperitoneal d-luciferin (150 mg/kg), and ventral tumor burden was assessed by the Xenogen 100 in vivo imaging system. Mice were imaged up to 3 at a time, separated by opaque shields. Saturated luminescent signals were imaged for shorter durations, down to 2 seconds. Each black line represents 1 animal; dots along the line indicate an imaging time point. The thick red line represents the average tumor burden of mice that received PSMA-specific T cells. Fractions in the lower right corner of each graph represent the proportion of 19z1-treated surviving mice at day 106. Bioluminescent images from 3 representative mice from 1 experiment at day 27 after tumor challenge are shown. 19z1 data are from 3 pooled experiments (n = 5-10), each testing T cells from a different donor. (B-C) Efficacy of tumor immunotherapy with cytokine-transduced T cells. Kaplan-Meier survival curves depicting overall survival (B), and tumor-free survival (C) in which mice were considered tumor free if their tumor burden was < 104 photons/s/cm2/sr. Pz1-ΔLNGFR/cytokine refers to the combined survival of all mice treated with PSMA-specific T cells. *P < .05, #P < .005 versus 19z1-ΔLNGFR.
Figure 3
Figure 3
Differential effect of IL-2, IL-7, IL-15, and IL-21 gene transfer on tumor-specific human T-cell proliferation and Bcl-2 expression. (A) Proliferation of transduced T cells in response to mitogenic stimulation. On day 7 after AAPC stimulation, 19z1+ T cells were purified, labeled with CFSE (2μM), and stimulated with plate-bound anti-CD3 (10 μg/mL) and soluble anti-CD28 (1 μg/mL) antibodies. At 3 and 8 days later, T cells were analyzed for CFSE dilution of the CD4+ and CD8+ subsets. One of 2 donors is shown with similar results observed in both. (B) Bcl-2 expression by transduced T cells. On day 7 after AAPC stimulation, T cells were assessed for expression of Bcl-2 protein by flow cytometry. Histograms are representative of 4 donors and have been gated on 19z1+CD4+ or 19z1+CD8+ T cells. The bar graph depicts Bcl-2 MFI (± SEM) of 19z1+CD4+ or 19z1+CD8+ cells from 4 donors that has been normalized such that the MFI of Bcl-2 for the 19z1-ΔLNGFR group = 1. *P < .05, **P < .01, #P < .005 versus 19z1-ΔLNGFR.
Figure 4
Figure 4
Differential effector functions of tumor-specific human primary T cells overexpressing IL-2, IL-7, IL-15, or IL-21. (A) Antigen-specific cytotoxic activity of transduced T cells. On day 6 after AAPC stimulation, T cells were assessed for cytolytic potential in a 4-hour chromium-release assay using EL4-hCD19 and EL4-hPSMA as the relevant and irrelevant targets (T). Effectors (E) were defined as 19z1+CD8+ T cells. Data are average (± SEM) from 4 donors. *P < .05, #P < .005 versus 19z1-ΔLNGFR. (B) Intracellular expression of granzyme A by transduced T cells. On day 7 after AAPC stimulation, T cells were analyzed by flow cytometry for the cytolytic molecule granzyme A. Average percent granzyme A+ T cells (± SEM) of 19z1+CD4+ and 19z1+CD8+ subsets from 7 donors is indicated. (C) IFN-γ, TNF-α, and IL-2 expression by transgenic T cells. On day 7 after AAPC stimulation, 19z1+ T cells were purified and treated with no stimulation (unstimulated) or anti-CD3/anti-CD28 antibodies (CD3/CD28) in the presence of brefeldin A and monensin. After 6 hours, T cells were analyzed for cytokine expression by intracellular flow cytometry. The percentage of CD4+ (top row) or CD8+ (bottom row) T cells that express the indicated effector cytokine from 5 donors is indicated. Horizontal bar indicates average. *P < .05, **P < .01, #P < .005 versus 19z1-ΔLNGFR.
Figure 5
Figure 5
Effector memory phenotype of tumor-specific human CD8+ T cells overexpressing IL-2, IL-7, IL-15, or IL-21. (A) CCR7 expression of CD8+ T cells 7 days after AAPC stimulation. Histograms have been gated on the CD8+CD45RACD45RO+ subset and are from 1 of 2 donors with similar results observed in both. Thick black line indicates 19z1+; thin black line, 19z1; and gray line, isotype control. (B) CD62L expression of CD8+ T cells 7 days after AAPC stimulation. Histograms are representative of 8 donors and have been gated on the 19z1+CD8+CD45RACD45RO+ subset. The bar graph represents the average percentage (± SEM) of CD62L T cells within the 19z1+CD8+CD45RACD45RO+ subset from 8 donors. Histograms for individual experiments are shown in supplemental Figure 7. (C) CD27 and CD28 expression of CD8+ T cells 7 days after AAPC stimulation. Dot plots are representative of 4 donors and have been gated on the 19z1+CD8+ subset. The bar graph represents the average percentage (± SEM) of CD27+CD28+ (TEM1), CD27+CD28 (TEM2), CD27CD28 (TEM3), and CD27CD28+ (TEM4) within the 19z1+CD8+ subset from 4 donors. *P < .05, **P < .01, #P < .005 versus 19z1-ΔLNGFR.
Figure 6
Figure 6
Long-term in vivo persistence of human T cells in surviving mice treated with ΔLNGFR–, IL-7–, IL-15–, or IL-21–overexpressing T cells. (A) Identification of human T cells in the spleen of tumor-free mice on days 106 to 110 after tumor challenge. Dot plots represent the indicated mice. Graphs indicate the percentage and absolute number of human CD3+ cells in the spleen of individual mice. Each circle represents an individual mouse (no T cells, n = 2; 19z1-ΔLNGFR, n = 4; 19z1-IL7, n = 7; 19z1-IL15, n = 4; 19z1-IL21, n = 10). Horizontal bar indicates average. (B) Expression of CD45RA, CCR7, and CD62L by persisting human CD8+ T cells in long-term surviving mice. Histograms are from representative mice and have been gated on the CD3+CD8+ subset (inferred from the CD3+CD4 gate). Dot plots for the 19z1-ΔLNGFR and 19z1-IL21 groups have been gated on the CD3+CD4CD45RA cells and dot plots for the 19z1-IL15 group have been gated on the CD3+CD4CD45RA+ cells.

References

    1. Dunn GP, Old LJ, Schreiber RD. The three Es of cancer immunoediting. Annu Rev Immunol. 2004;22:329–360. - PubMed
    1. Zou W. Immunosuppressive networks in the tumour environment and their therapeutic relevance. Nat Rev Cancer. 2005;5(4):263–274. - PubMed
    1. Nagaraj S, Gabrilovich DI. Tumor escape mechanism governed by myeloid-derived suppressor cells. Cancer Res. 2008;68(8):2561–2563. - PubMed
    1. Pandiyan P, Zheng L, Ishihara S, Reed J, Lenardo MJ. CD4+CD25+Foxp3+ regulatory T cells induce cytokine deprivation-mediated apoptosis of effector CD4+ T cells. Nat Immunol. 2007;8(12):1353–1362. - PubMed
    1. Rochman Y, Spolski R, Leonard WJ. New insights into the regulation of T cells by gamma (c) family cytokines. Nat Rev Immunol. 2009;9(7):480–490. - PMC - PubMed

Publication types

MeSH terms