

Signatures of polycomb repression and reduced H3K4 trimethylation are associated with p15INK4b DNA methylation in AML
- PMID: 20190193
- PMCID: PMC2858468
- DOI: 10.1182/blood-2009-07-233858
Signatures of polycomb repression and reduced H3K4 trimethylation are associated with p15INK4b DNA methylation in AML
Abstract
DNA hypermethylation of the p15INK4b tumor suppressor gene is commonly observed in acute myeloid leukemia (AML). Repressive histone modifications and their associated binding proteins have been implicated in the regulation of DNA methylation and the transcriptional repression of genes with DNA methylation. We have used high-density chromatin immunoprecipitation-on-chip to determine the histone modifications that normally regulate p15INK4b expression in AML cells and how these marks are altered in cells that have p15INK4b DNA methylation. In AML patient blasts without p15INK4b DNA methylation, a bivalent pattern of active (H3K4me3) and repressive (H3K27me3) modifications exist at the p15INK4b promoter. AML patient blasts with p15INK4b DNA methylation lose H3K4me3 at p15INK4b and become exclusively marked by H3K27me3. H3K27me3, as well as EZH2, extends throughout p14ARF and p16INK4a, indicating that polycomb repression of p15INK4b is a common feature in all AML blasts irrespective of the DNA methylation status of the gene. Reactivation of p15INK4b expression in AML cell lines and patient blasts using 5-aza-2'-deoxycytidine (decitabine) and trichostatin A increased H3K4me3 and maintained H3K27me3 enrichment at p15INK4b. These data indicate that AML cells with p15INK4b DNA methylation have an altered histone methylation pattern compared with unmethylated samples and that these changes are reversible by epigenetic drugs.
Figures
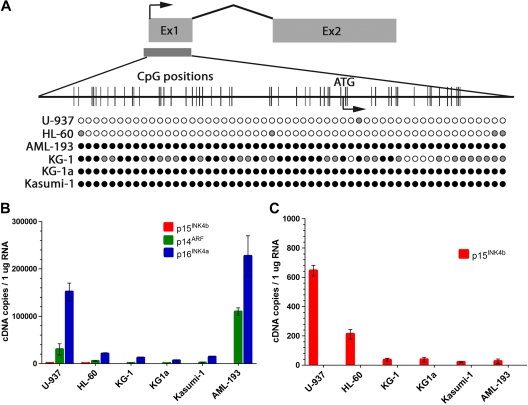
 , 10%-49% methylcytosine). (B-C) Quantitative reverse-transcriptase (RT)–PCR analysis of p15INK4b, p14ARF, and p16INK4a expression in AML cell lines. Copies of cDNA per 100 ng of total RNA were calculated from a plasmid DNA standard curve and represent the averages of 3 independent experiments with error bars of SD.
 , 10%-49% methylcytosine). (B) Quantitative RT-PCR analysis of p15INK4b expression in AML patient blasts. cDNA copies per 50 ng total RNA were calculated from a plasmid DNA standard curve and represent the averages of 3 independent experiments with error bars of SD. Quantitative PCR analysis (C) of H3K4me3 and H3K27me3 enrichment at the p15INK4b promoter. Data are averages of ΔΔCt compared with input DNA from 3 technical replicates with error bars of SD. ChIP-on-chip analysis of enrichment of H3K4me3 (blue) and H3K27me3 (red) on chromosome 9: 21953000 to 22003000 (D) and chromosome 9: 21990000 to 22003000 (E) in AML patient samples. Top axis represents H3K4me3; and bottom axis, H3K27me3. Normalized enrichment data (IP/input) are plotted on a log 2 scale.
 , 10%-49% methylcytosine).
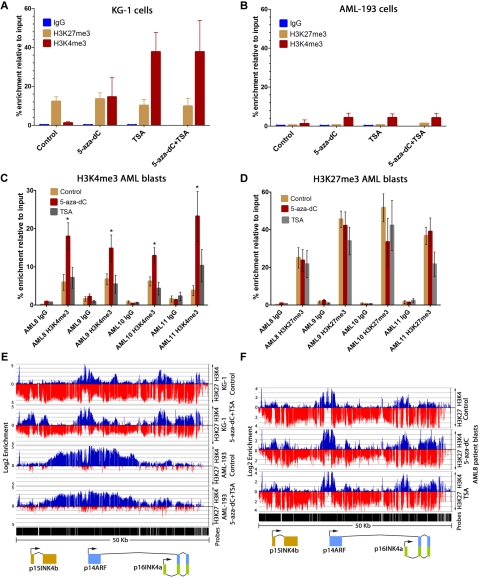
Similar articles
-
Zebularine inhibits human acute myeloid leukemia cell growth in vitro in association with p15INK4B demethylation and reexpression.Exp Hematol. 2007 Feb;35(2):263-73. doi: 10.1016/j.exphem.2006.10.005. Exp Hematol. 2007. PMID: 17258075
-
Reexpression of epigenetically silenced AML tumor suppressor genes by SUV39H1 inhibition.Oncogene. 2010 Jan 28;29(4):576-88. doi: 10.1038/onc.2009.361. Epub 2009 Nov 2. Oncogene. 2010. PMID: 19881540
-
Identification of coexistence of DNA methylation and H3K27me3 specifically in cancer cells as a promising target for epigenetic therapy.Carcinogenesis. 2015 Feb;36(2):192-201. doi: 10.1093/carcin/bgu238. Epub 2014 Dec 4. Carcinogenesis. 2015. PMID: 25477340
-
EZH2 methyltransferase and H3K27 methylation in breast cancer.Int J Biol Sci. 2012;8(1):59-65. doi: 10.7150/ijbs.8.59. Epub 2011 Nov 18. Int J Biol Sci. 2012. PMID: 22211105 Free PMC article. Review.
-
The epigenetic role of EZH2 in acute myeloid leukemia.PeerJ. 2024 Dec 6;12:e18656. doi: 10.7717/peerj.18656. eCollection 2024. PeerJ. 2024. PMID: 39655332 Free PMC article. Review.
Cited by
-
Long non-coding RNA LUCAT1 is associated with poor prognosis in human non-small lung cancer and regulates cell proliferation via epigenetically repressing p21 and p57 expression.Oncotarget. 2017 Apr 25;8(17):28297-28311. doi: 10.18632/oncotarget.16044. Oncotarget. 2017. PMID: 28423699 Free PMC article.
-
Increased expression of long noncoding RNA TUG1 predicts a poor prognosis of gastric cancer and regulates cell proliferation by epigenetically silencing of p57.Cell Death Dis. 2016 Feb 25;7(2):e2109. doi: 10.1038/cddis.2015.356. Cell Death Dis. 2016. PMID: 26913601 Free PMC article.
-
Ectopic expression of the histone methyltransferase Ezh2 in haematopoietic stem cells causes myeloproliferative disease.Nat Commun. 2012 Jan 10;3:623. doi: 10.1038/ncomms1623. Nat Commun. 2012. Retraction in: Nat Commun. 2017 Mar 07;8:14005. doi: 10.1038/ncomms14005. PMID: 22233633 Retracted.
-
Methylation of p15INK4b and expression of ANRIL on chromosome 9p21 are associated with coronary artery disease.PLoS One. 2012;7(10):e47193. doi: 10.1371/journal.pone.0047193. Epub 2012 Oct 16. PLoS One. 2012. PMID: 23091611 Free PMC article.
-
KDM2b/JHDM1b, an H3K36me2-specific demethylase, is required for initiation and maintenance of acute myeloid leukemia.Blood. 2011 Apr 7;117(14):3869-80. doi: 10.1182/blood-2010-10-312736. Epub 2011 Feb 10. Blood. 2011. PMID: 21310926 Free PMC article.
References
-
- Herman JG, Civin CI, Issa JP, Collector MI, Sharkis SJ, Baylin SB. Distinct patterns of inactivation of p15INK4B and p16INK4A characterize the major types of hematological malignancies. Cancer Res. 1997;57(5):837–841. - PubMed
-
- Drexler HG. Review of alterations of the cyclin-dependent kinase inhibitor INK4 family genes p15, p16, p18 and p19 in human leukemia-lymphoma cells. Leukemia. 1998;12(6):845–859. - PubMed
-
- Sherr CJ, Roberts JM. CDK inhibitors: positive and negative regulators of G1-phase progression. Genes Dev. 1999;13(12):1501–1512. - PubMed
-
- Hannon GJ, Beach D. p15INK4B is a potential effector of TGF-beta-induced cell cycle arrest. Nature. 1994;371(6494):257–261. - PubMed
-
- Schmidt M, Bies J, Tamura T, Ozato K, Wolff L. The interferon regulatory factor ICSBP/IRF-8 in combination with PU.1 up-regulates expression of tumor suppressor p15(Ink4b) in murine myeloid cells. Blood. 2004;103(11):4142–4149. - PubMed
Publication types
MeSH terms
Substances
Grants and funding
LinkOut - more resources
Full Text Sources
Medical
Molecular Biology Databases
