

Review
doi: 10.3174/ajnr.A2026.
Epub 2010 Feb 25.
Evaluation of CT perfusion in the setting of cerebral ischemia: patterns and pitfalls
Affiliations
- PMID: 20190208
- PMCID: PMC7965002
- DOI: 10.3174/ajnr.A2026
Item in Clipboard
Review
Evaluation of CT perfusion in the setting of cerebral ischemia: patterns and pitfalls
AJNR Am J Neuroradiol.
2010 Oct.
Abstract
CTP has a growing role in evaluating stroke. It can be performed immediately following NCCT and has advantages of accessibility and speed. Differentiation of salvageable ischemic penumbra from unsalvageable core infarct may help identify patients most likely to benefit from thrombectomy or thrombolysis. Still, CTP interpretation can be complex. We review normal and ischemic perfusion patterns followed by an illustrative series of technical/diagnostic challenges of CTP interpretation in the setting of acute stroke syndromes.
Figures
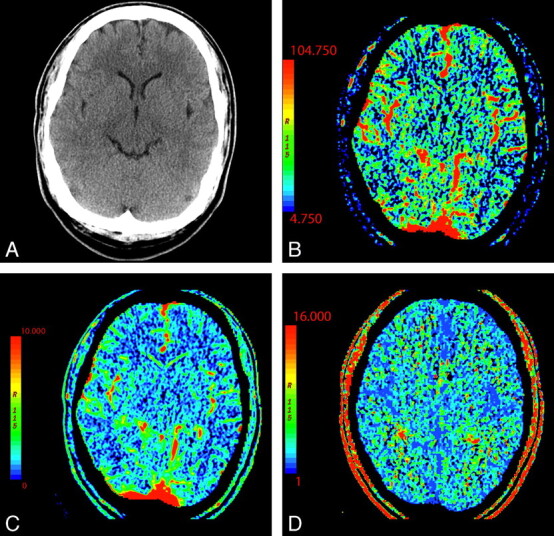
NCCT (A) and CTP parametric maps, CBF (B), CBV (C), and MTT (D), demonstrate normal symmetric brain perfusion. By convention, all color maps are coded red for higher values and blue for lower values.
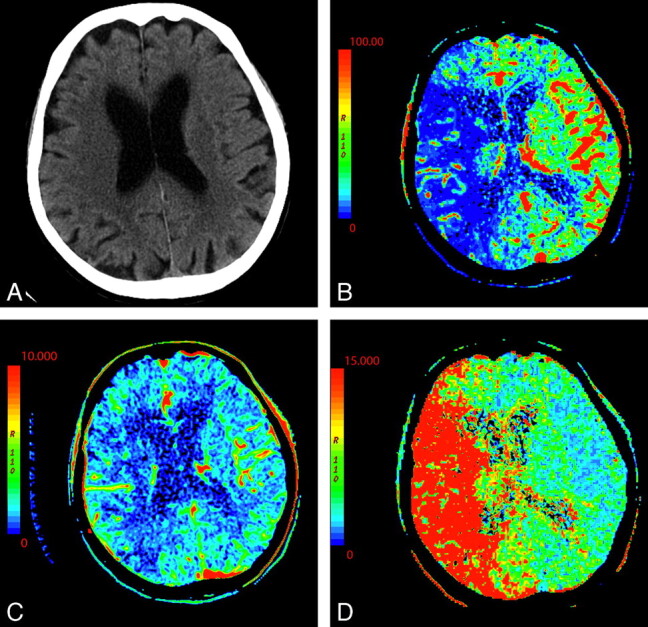
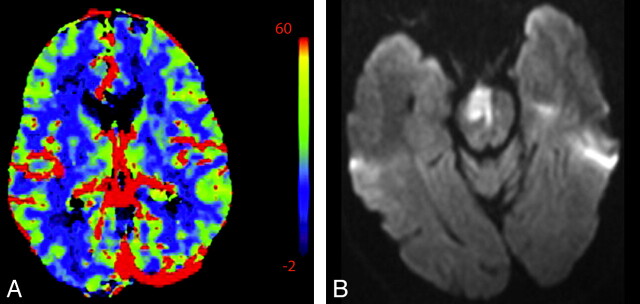
An 87-year-old woman presenting with acute dysarthria, left facial droop, and left-sided weakness. On admission, NCCT and CTP were performed concurrently. A, NCCT shows some microvascular ischemic changes posteriorly. B−D, CTP maps, CBF (B), CBV (C), and MTT (D), demonstrate a large area of matched deficit on CBV and MTT maps, indicative of core infarct in the right MCA territory.
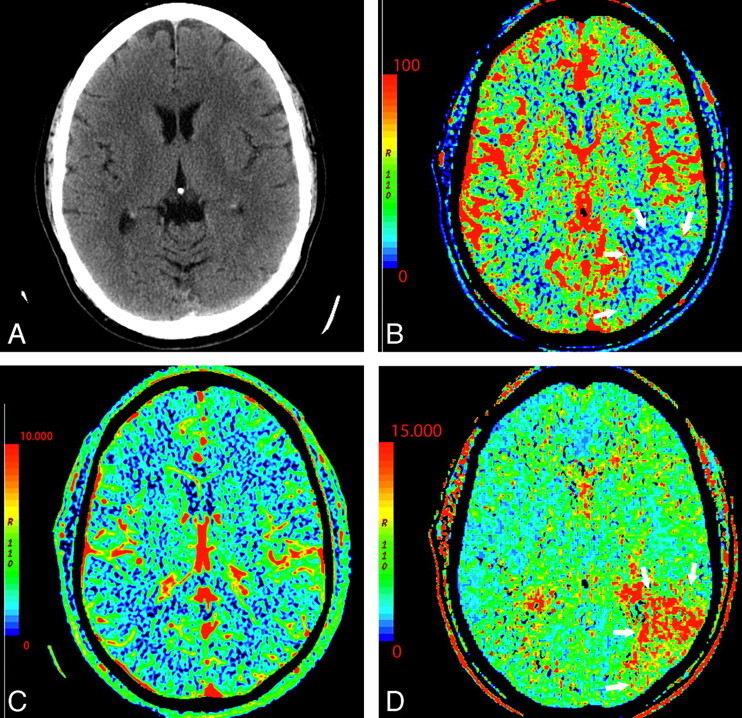
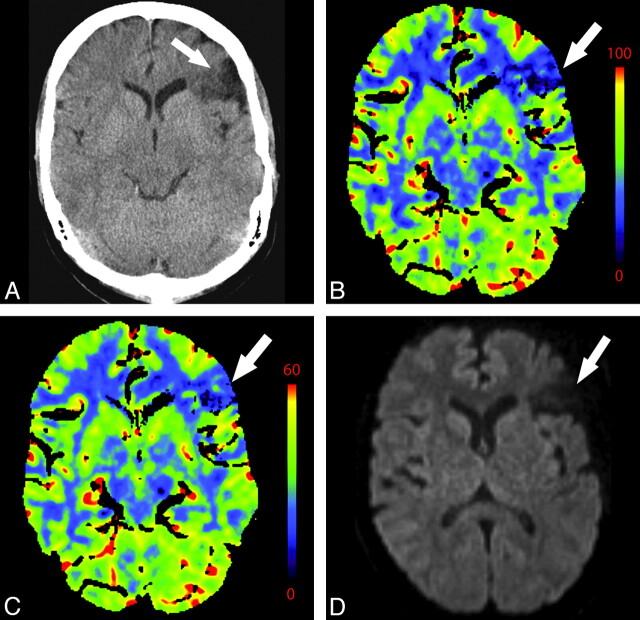
A 64-year-old man presenting with headache and acute aphasia. A, On admission, NCCT and CTP were performed. NCCT shows no evidence of acute infarction. B, CT perfusion CBF map shows a region of decreased perfusion within the posterior segment of the left MCA territory (arrows). D, MTT map shows a corresponding prolongation within this same region (arrows). C, CBV map demonstrates no abnormality, therefore, representing a CBV/MTT mismatch or ischemic penumbra.
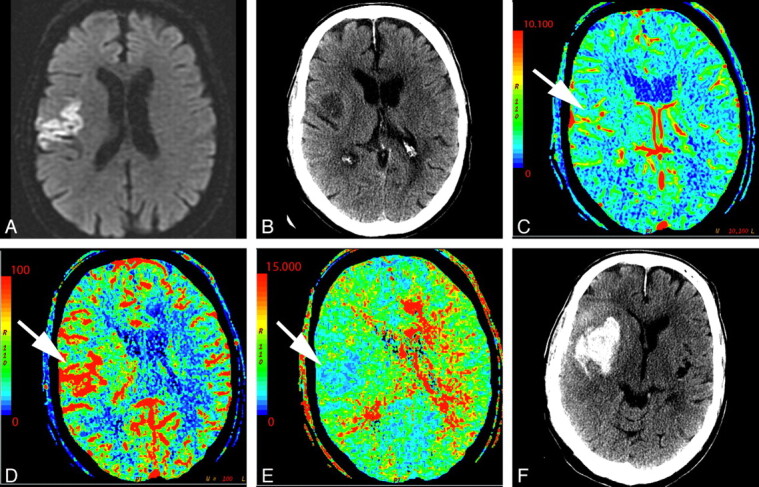
A 74-year-old man who presented to the emergency department after a fall with left-sided weakness. Initial CT findings were normal (not shown). A, DWI sequence obtained 2 days later demonstrated an acute/subacute right frontal infarct. B, Several hours later, the patient had new contralateral symptoms, which prompted this CTP study. NCCT at that time demonstrated the right frontal opercular infarct. C−E, CT perfusion demonstrates asymmetric perfusion with relatively increased CBV (C), increased CBF (D), and decreased MTT (E) in this region (arrows) compared with the contralateral brain. This is consistent with postischemic hyperperfusion. Of note, no abnormalities are seen in the left hemisphere. F, The following day, the patient's symptoms progressed, and follow-up NCCT shows hemorrhage in the region of subacute infarction.

A 76-year-old man presenting with acute right-sided symptoms. A, NCCT is normal. CTP map demonstrates a large left MCA stroke with penumbra. B, The CBF map and D, the MTT map demonstrate decreased flow and prolongation of MTT in most of the left MCA territory (arrows) with a CBF (10 mL 100 g1 min1). C, On the CBV map, there is a region of decreased perfusion in the left basal ganglia only (arrows). This represents a CBV/MTT mismatch or ischemic penumbra. The CBV on the ischemic side is 0.6 mL × 100 g−1. Relative MTT on the ischemic side is 500% increased within the core and 200% increased within the penumbra compared with homologous contralateral brain.
A 58-year-old man presenting with acute left hemiparesis and what was thought to be acute right MCA syndrome. A, CTP at admission demonstrates symmetric and normal-appearing perfusion; CBV is shown. B, However, an acute infarct is seen on DWI outside the volume imaged during CTP.
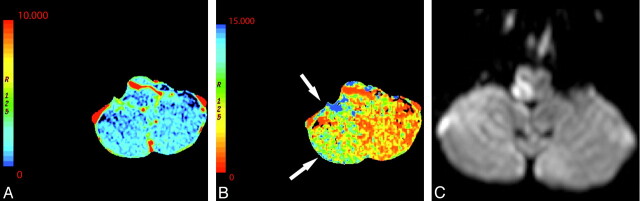
A 61-year-old man presenting with an acute right Wallenberg syndrome. A and B, CBV (A) and MTT (B) maps (here shown in reverse color scheme) obtained through the level of the posterior fossa show an area of ischemic penumbra in the right posterior inferior cerebellar artery territory (arrows). C, DWI confirms a right lateral medullary infarct with salvage of the right inferior cerebellar hemisphere penumbra.
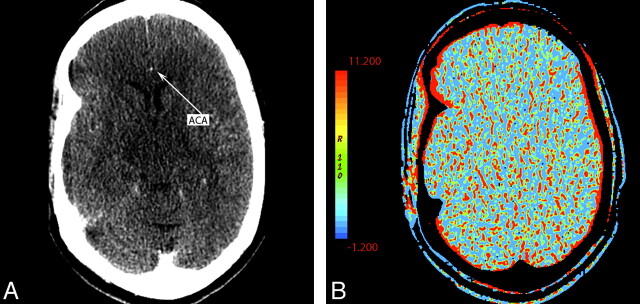
A 55-year-old woman presenting with left hemiparesis and normal findings on head CT. A, CTP source image shows poor contrast opacification within the right ACA (arrow). Commonly, the A2 segment of the ACA can be used for AIF placement. In this case, this was inadequate and resulted in nondiagnostic functional CTP maps. B, CBV is shown as an example.

A, Inappropriate venous region-of-interest selection resulting in the CBV appearance mimicking global hypoperfusion. Perfusion was symmetric and normal following correct region-of-interest placement in the same patient (not shown). B, An example of appropriate placement of the AIF and VOF regions of interest is shown in the ACA and superior sagittal sinus, respectively. C, The corresponding normal findings on CBV are shown.
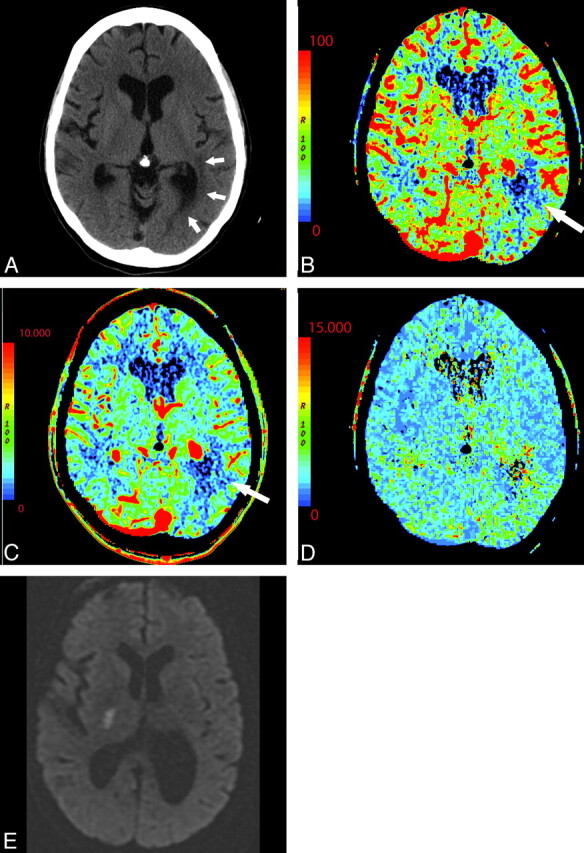
A 58-year-old woman with left-sided weakness. A−D, NCCT (A) shows left periatrial microvascular ischemic changes (arrows) corresponding to perfusion abnormalities of CBF (B), CBV (C), and MTT (D) maps (arrows). Strategically located infarcts may be symptomatic though small and difficult to detect. No gross asymmetric perfusion is seen in the region of the right internal capsule. E, DWI performed on the same day shows a small acute infarct in the posterior limb of the right internal capsule.
A 44-year-old woman with a history of anxiety disorder presenting with acute right facial weakness and expressive aphasia. She had no known history of prior stroke. CTP demonstrates a focal area of hypoperfusion in the left frontal lobe within an area of chronic-appearing infarct (arrows). Chronic infarcts have measurable though diminished perfusion. Areas of acute infarct adjacent to chronic infarcts may, therefore, be difficult to detect. NCCT (A), CBF (B), CBV (C), at presentation; DWI (D) 1 day later.
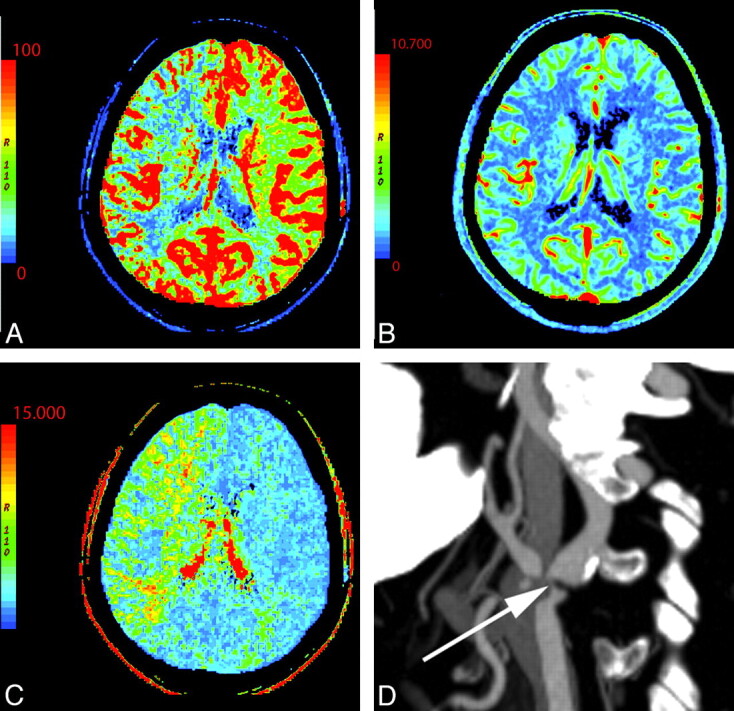
A 76-year-old man with change in mental status. NCCT findings (not shown) were normal. A−C, There is decreased CBF (A) and prolonged MTT (C) in the right MCA and ACA territories with preserved CBV (B). D, CTA reveals severe right ICA stenosis at its origin (arrow).
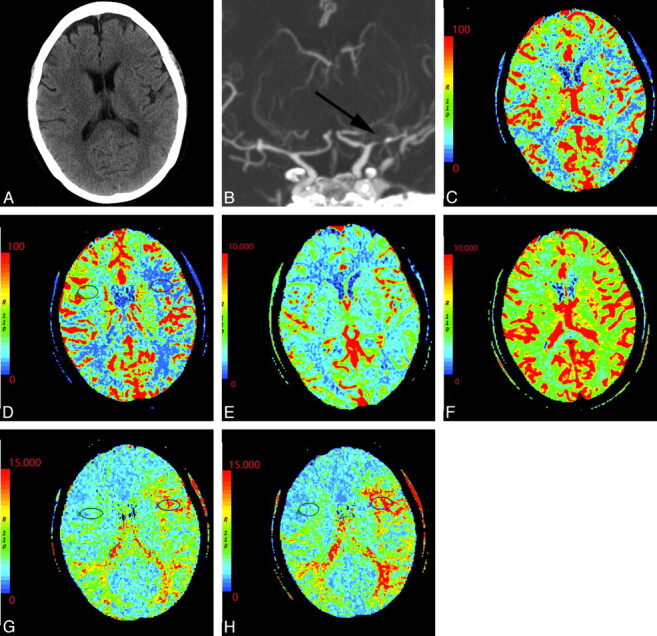
A 54-year-old woman with dizziness and right-sided weakness. A, NCCT shows no gross abnormality. B, Coronal MIP from CT angiography demonstrates severe M1 of the left MCA and prominent collateral vessels (arrow). C−H, CTP before and following the administration of acetazolamide: pre-CBF (C), post-CBF (D), pre-CBV (E), post-CBV (F), pre-MTT (G), and post-MTT (H) images. Technique and scaling of the images are identical before and after acetazolamide administration. There is global bihemispheric increase in CBF and CBV after acetazolamide administration; however, there is increased asymmetric perfusion between the poststenotic (left) and the nonstenotic territories (right) as seen within the oval regions of interest. This is best seen as prolonged MTT following acetazolamide in portions of the left MCA territory relative to the baseline CT perfusion scan.
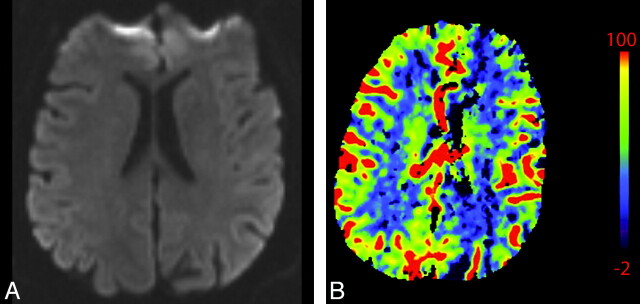
A 55-year-old man presenting with acute altered mental status, right facial droop, and right upper extremity weakness and witnessed generalized tonic-clonic seizure. A, NCCT (not shown) and DWI (A) findings are normal. B, CBV shows hypoperfusion in the left hemisphere, mimicking core infarct. Electroencephalography and PET studies (not shown) later demonstrated a right hemispheric seizure focus, supporting CTP ictal hyperperfusion related to seizure rather than relative hypoperfusion related to left hemispheric infarct. The patient's symptoms resolved.
Similar articles
-
Optimal thresholds for ischemic penumbra predicted by computed tomography perfusion in patients with acute ischemic stroke treated with mechanical thrombectomy.J Neurointerv Surg. 2018 Mar;10(3):279-284. doi: 10.1136/neurintsurg-2017-013083. Epub 2017 Jun 9. J Neurointerv Surg. 2018. PMID: 28600481
-
Perfusion computed tomography thresholds defining ischemic penumbra and infarct core: studies in a rat stroke model.Int J Stroke. 2015 Jun;10(4):553-9. doi: 10.1111/ijs.12147. Epub 2013 Oct 21. Int J Stroke. 2015. PMID: 24138577
-
Theoretic basis and technical implementations of CT perfusion in acute ischemic stroke, part 2: technical implementations.AJNR Am J Neuroradiol. 2009 May;30(5):885-92. doi: 10.3174/ajnr.A1492. Epub 2009 Mar 19. AJNR Am J Neuroradiol. 2009. PMID: 19299489 Free PMC article. Review.
-
Admission CT perfusion may overestimate initial infarct core: the ghost infarct core concept.J Neurointerv Surg. 2017 Jan;9(1):66-69. doi: 10.1136/neurintsurg-2016-012494. Epub 2016 Aug 26. J Neurointerv Surg. 2017. PMID: 27566491
-
"Code-Stroke" CT Perfusion; Challenges and Pitfalls.Acad Radiol. 2019 Nov;26(11):1565-1579. doi: 10.1016/j.acra.2018.12.013. Epub 2019 Jan 14. Acad Radiol. 2019. PMID: 30655051 Review.
Cited by
-
Neurovascular emergencies: imaging diagnosis and neurointerventional treatment.Emerg Radiol. 2017 Apr;24(2):183-193. doi: 10.1007/s10140-016-1450-x. Epub 2016 Oct 7. Emerg Radiol. 2017. PMID: 27718098 Review.
-
A novel computed tomography perfusion-based quantitative tool for evaluation of perfusional abnormalities in migrainous aura stroke mimic.Neurol Sci. 2020 Nov;41(11):3321-3328. doi: 10.1007/s10072-020-04476-5. Epub 2020 May 26. Neurol Sci. 2020. PMID: 32458253
-
Research progress of imaging technologies for ischemic cerebrovascular diseases.J Int Med Res. 2021 Mar;49(3):300060520972601. doi: 10.1177/0300060520972601. J Int Med Res. 2021. PMID: 33730890 Free PMC article. Review.
-
Artificial intelligence for localization of the acute ischemic stroke by non-contrast computed tomography.PLoS One. 2022 Dec 1;17(12):e0277573. doi: 10.1371/journal.pone.0277573. eCollection 2022. PLoS One. 2022. PMID: 36454916 Free PMC article.
-
TMS-Induced Central Motor Conduction Time at the Non-Infarcted Hemisphere Is Associated with Spontaneous Motor Recovery of the Paretic Upper Limb after Severe Stroke.Brain Sci. 2021 May 15;11(5):648. doi: 10.3390/brainsci11050648. Brain Sci. 2021. PMID: 34063558 Free PMC article.
References
-
- de Lucas EM, Sanchez E, Gutierrez A, et al. . CT protocol for acute stroke: tips and tricks for general radiologists. Radiographics 2008; 28: 1673– 87 - PubMed
-
- Tissue plasminogen activator for acute ischemic stroke: The National Institute of Neurological Disorders and Stroke rt-PA Stroke Study Group. N Engl J Med 1995; 333: 1581– 87 - PubMed
-
- Dzialowski I, Hill MD, Coutts SB, et al. . Extent of early ischemic changes on computed tomography (CT) before thrombolysis: prognostic value of the Alberta Stroke Program Early CT Score in ECASS II. Stroke 2006; 37: 973– 78. Epub 2006 Feb 23 - PubMed
-
- Furlan A, Higashida R, Wechsler L, et al. . Intra-arterial prourokinase for acute ischemic stroke: the PROACT II study—a randomized controlled trial. Prolyse in Acute Cerebral Thromboembolism. JAMA 1999; 282: 2003– 11 - PubMed
-
- Schramm P, Schellinger PD, Klotz E, et al. . Comparison of perfusion computed tomography and computed tomography angiography source images with perfusion-weighted imaging and diffusion-weighted imaging in patients with acute stroke of less than 6 hours' duration. Stroke 2004; 35: 1652– 58 - PubMed
Publication types
MeSH terms
LinkOut - more resources
Full Text Sources
Medical