. 2010 May;3(3):314-22.
doi: 10.1161/CIRCIMAGING.109.918482. Epub 2010 Feb 27.

Rapid 3D phenotyping of cardiovascular development in mouse embryos by micro-CT with iodine staining

Affiliations

Rapid 3D phenotyping of cardiovascular development in mouse embryos by micro-CT with iodine staining

Karl Degenhardt et al. Circ Cardiovasc Imaging. 2010 May.

Abstract

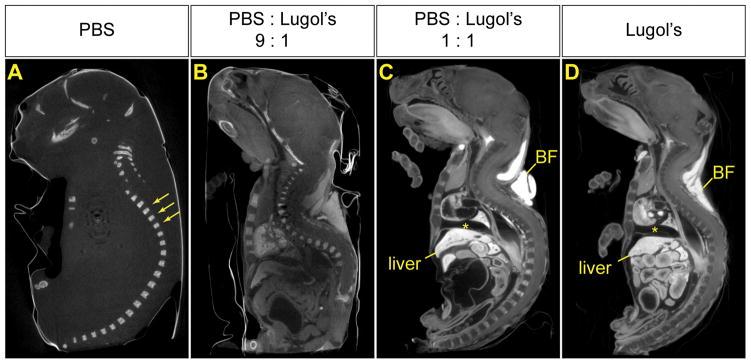
Background: Microcomputed tomography (micro-CT) has been used extensively in research to generate high-resolution 3D images of calcified tissues in small animals nondestructively. It has been especially useful for the characterization of skeletal mutations but limited in its utility for the analysis of soft tissue such as the cardiovascular system. Visualization of the cardiovascular system has been largely restricted to structures that can be filled with radiopaque intravascular contrast agents in adult animals. Recent ex vivo studies using osmium tetroxide, iodinated contrast agents, inorganic iodine, and phosphotungstic acid have demonstrated the ability to stain soft tissues differentially, allowing for high intertissue contrast in micro-CT images. In the present study, we demonstrate the application of this technology for visualization of cardiovascular structures in developing mouse embryos using Lugol solution (aqueous potassium iodide plus iodine).

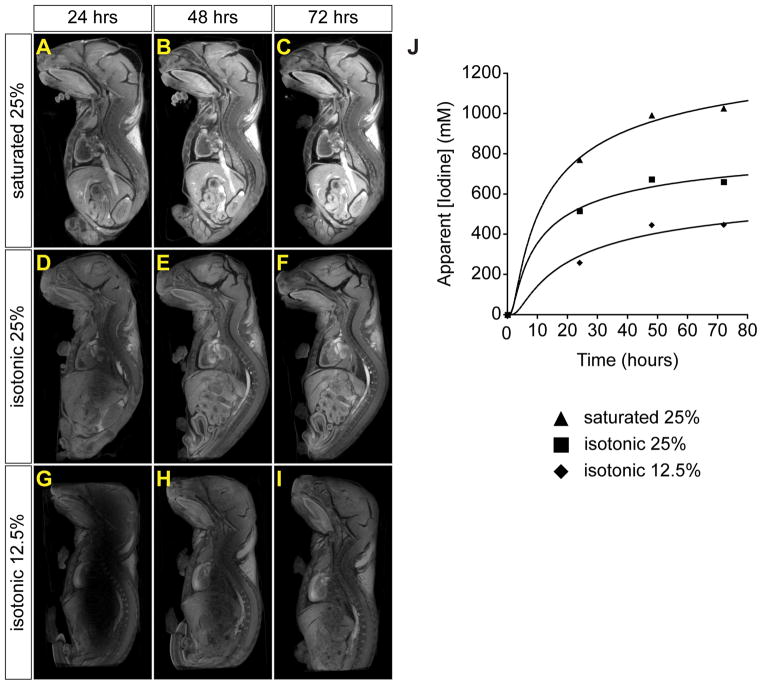
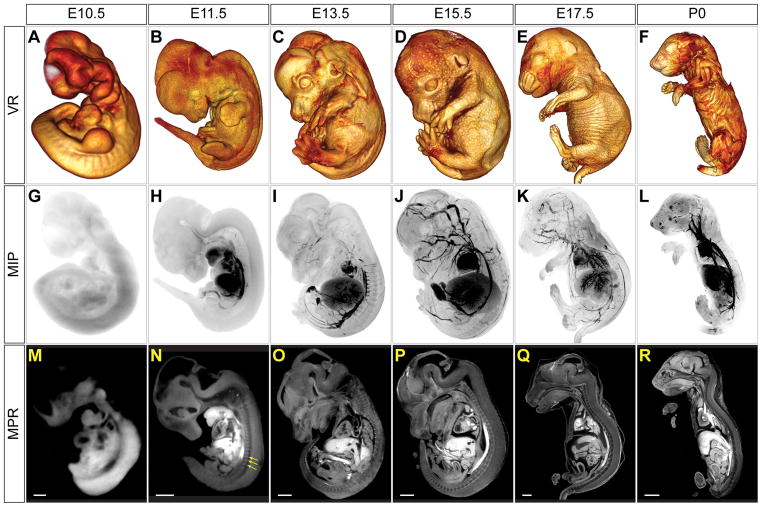
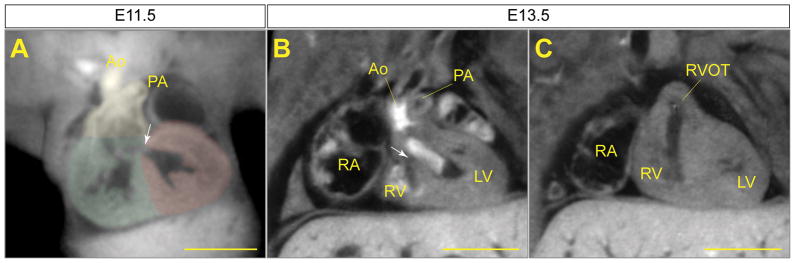
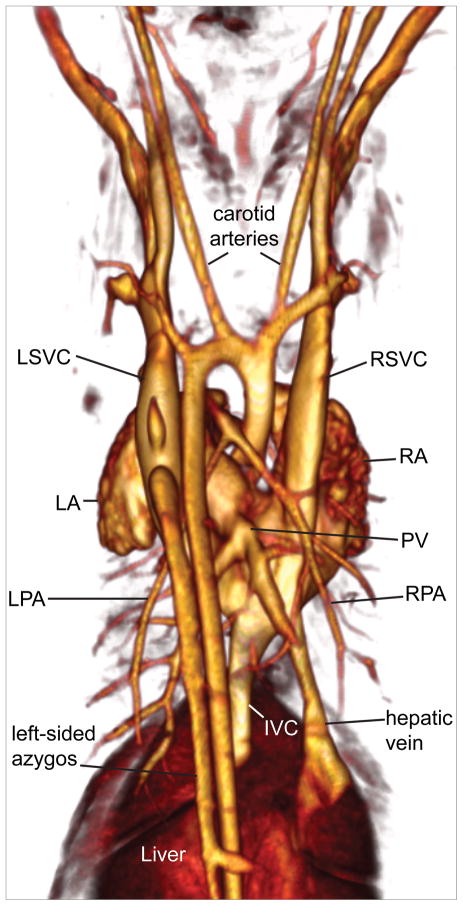
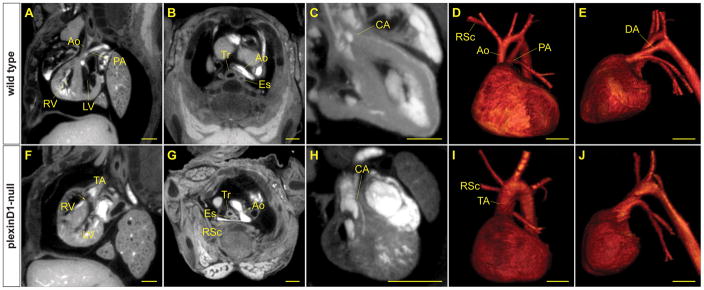
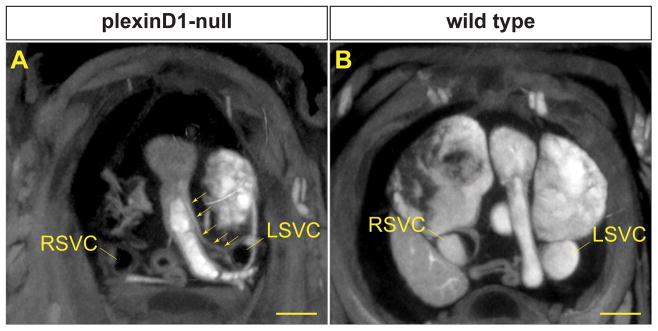
Methods and results: We show the optimization of this method to obtain ex vivo micro-CT images of embryonic and neonatal mice with excellent soft-tissue contrast. We demonstrate the utility of this method to visualize key structures during cardiovascular development at various stages of embryogenesis. Our method benefits from the ease of sample preparation, low toxicity, and low cost. Furthermore, we show how multiple cardiac defects can be demonstrated by micro-CT in a single specimen with a known genetic lesion. Indeed, a previously undescribed cardiac venous abnormality is revealed in a PlexinD1 mutant mouse.

Conclusions: Micro-CT of iodine-stained tissue is a valuable technique for the characterization of cardiovascular development and defects in mouse models of congenital heart disease.


Conflict of interest statement

Conflict of Interest Disclosures: None.

Figures

Figure 1
Figure 1
Aqueous iodine stains soft tissue differentially in a concentration dependent manner. Four neonatal mice were treated with a mixture of PBS and 100% Lugol’s solution in different ratios, prior to scanning by micro-CT. Representative sagittal MPR images are shown. Windowing for each image was separately optimized to maximize anatomic visibility. (A) Only calcified bony structures, such as vertebrae (arrows) are visible in a specimen treated in PBS alone. (B) The 9:1 mixture of PBS and Lugol’s solution brings out many soft tissue structures, however, most tissues stain similarly and overall signal to noise ratio is poor. Moreover, the central part of the specimen remains unstained. (C, D) The 1:1 mixture of PBS and Lugol’s solution (C) and 100% Lugol’s solution (D) both impart differential attenuation to soft tissues, with brown fat (BF), liver and blood staining most intensely. However, there is some tissue distortion. Note the space between the diaphragm and heart (*).
Figure 2
Figure 2
The time course of progressive iodine diffusion and staining intensity varies with concentration of iodine in the stain solution. Three neonatal mice were stained with isotonic solutions of varying iodine concentrations and scanned by micro-CT serially over one (A, D, G), two (B, E, H) or three (C, F, I) days. Representative sagittal MPR images from three mouse neonates are shown. Windowing for all images is the same to allow comparison of staining intensity between panels. (A-C) Saturated 25% Lugol’s gives rapid penetration and intense staining, however, significant shrinkage is seen. (D-F) Lugol’s solution diluted to 25% in water shows good penetration by 48 hours with minimal tissue distortion. (G-I) 12.5% Lugol’s solution fails to penetrate uniformly by 72 hours, but does show progressive diffusion of iodine into the tissue. (J) Apparent iodine concentration in tissue versus time for a ROI in the brain stem of each mouse. Solid lines are fits of the one-dimensional diffusion equation (Equation 1) to the data points.
Figure 3
Figure 3
Visualization of mouse development by micro-CT. Three viewing modes are used to generate micro-CT images of mouse embryos at stages E10.5, E11.5, E13.5, E15.5 and E17.5. Also shown is a neonate at P0 (skin removed). (A-F) Volume rendering (VR) windowed to show external features allows for accurate staging. (G-L) Maximum intensity projection (MIP) images show that blood is most intensely stained, allowing delineation of many vascular structures. (M-R) Representative sagittal sections generated by multi-planar reformatting (MPR) show differential staining of soft tissues in all stages except E10.5. By E11.5 even structures such as somites (arrows) can be delineated. Scale bars = 200 μm (E10.5), 800 μm (E11.5–E13.5), 1 mm (E15.5–P0).
Figure 4
Figure 4
Cardiac septation events viewed by micro-CT. MPR images at planes chosen to best illustrate septation of the conotruncus, while the ventricular septum remains incomplete. (A) At E11.5 the conotrucus (highlighted in yellow) is connected to both the aorta (Ao) and pulmonary artery (PA) but there is a single outlet from the presumptive right ventricle (highlighted in green). The bulboventricular foramen (arrow) is the only route of egress from the presumptive left ventricle (highlighted in red). (B) By E13.5, the aorta has aligned with the left ventricle (LV). The aorta and left ventricle are partially filled with blood, giving areas of high and low attenuation in the lumens. Note that the bulboventricular foramen remains patent (arrow). (C) In the same plane as (B), but more ventrally, a separate right ventricular outflow tract (RVOT) can be seen. RA- right atrium, RV- right ventricle. Scale bars = 500 μm.
Figure 5
Figure 5
Mouse vascular structure as viewed by micro-CT. Posterior view of VR image from a P0 mouse showing venous and arterial structures. LSVC- left superior vena cava, LA- left atrium, LPA- left pulmonary artery, IVC- inferior vena cava, RPA- right pulmonary artery, PV-pulmonary vein, RA- right atrium, RSVC- right superior vena cava.
Figure 6
Figure 6
Micro-CT demonstrates multiple cardiovascular defects in a mouse model of congenital heart disease with a known genetic lesion. MPR images of a wild type mouse (A-C) and a PlexinD1 mutant mouse (F-H) at E17.5. Off-axis sagittal views (A, F) show a ventricular septal defect (arrow) below the truncal arteriosus (TA) in the mutant compared to an intact septum in the wild type. Cross-sectional views (B, G) show the right subclavian artery (RSc) running posterior to the trachea (Tr) and esophagus (Es) in the mutant. The wild type right subclavian artery is not in view in the same plane. (C, H) In the wild type, a coronary artery (CA) arises normally from the sinus of Valsalva, whereas the mutant has a coronary artery arising from the sino-tubular junction (different planes). VR images illustrate the normal anatomy (D, E) of the aorta (Ao) and pulmonary artery (PA), as compared to the truncus arteriosus in the mutant (I, J). Note the absence of the ductus arteriosus (DA) in the mutant. Atria and other tissues have been cropped away to show the base of the great vessels and branching pattern of the arteries. Scale bars = 500 μm.
Figure 7
Figure 7
Micro-CT reveals aberrant venous structure in a PlexinD1 mutant. MPR image of a PlexinD1 null (A) shows a structure that runs from the anterior surface of the ventricle to the left superior vena cava (LSVC) (arrows). An equivalent view of the wild type control (B) shows no similar structure. Note that the wild type specimen has the LSVC opacified, as it is filled with blood, whereas the mutant LSVC is shown only by the outline of the vascular wall. Similarly, the right superior vena cava (RSVC) is partially filled with blood in the wild type, but unfilled in the PlexinD1 null. Scale bars = 500 μm.

Comment in

References

    1. Hoffman JI, Kaplan S. The incidence of congenital heart disease. J Am Coll Cardiol. 2002;39:1890–1900. - PubMed
    1. Horsthuis T, Christoffels VM, Anderson RH, Moorman AF. Can recent insights into cardiac development improve our understanding of congenitally malformed hearts? Clin Anat. 2009;22:4–20. - PubMed
    1. Kaufman MH, Brune RM, Davidson DR, Baldock RA. Computer-generated three-dimensional reconstructions of serially sectioned mouse embryos. J Anat. 1998;193:323–336. - PMC - PubMed
    1. Soufan AT, van den Berg G, Moerland PD, Massink MM, van den Hoff MJ, Moorman AF, Ruijter JM. Three-dimensional measurement and visualization of morphogenesis applied to cardiac embryology. J Microsc. 2007;225:269–274. - PubMed
    1. Dhanantwari P, Lee E, Krishnan A, Samtani R, Yamada S, Anderson S, Lockett E, Dono-frio M, Shiota K, Leatherbury L, Lo CW. Human cardiac development in the first trimester: a high-resolution magnetic resonance imaging and episcopic fluorescence image capture atlas. Circulation. 2009;120:343–351. - PMC - PubMed

Publication types

MeSH terms