. 2010 Apr;42(4):303-12.
doi: 10.1038/ng.538. Epub 2010 Feb 28.

Mutations in VIPAR cause an arthrogryposis, renal dysfunction and cholestasis syndrome phenotype with defects in epithelial polarization

Affiliations

Mutations in VIPAR cause an arthrogryposis, renal dysfunction and cholestasis syndrome phenotype with defects in epithelial polarization

Andrew R Cullinane et al. Nat Genet. 2010 Apr.

Erratum in

  • Nat Genet. 2011 Mar;43(3):277

Abstract

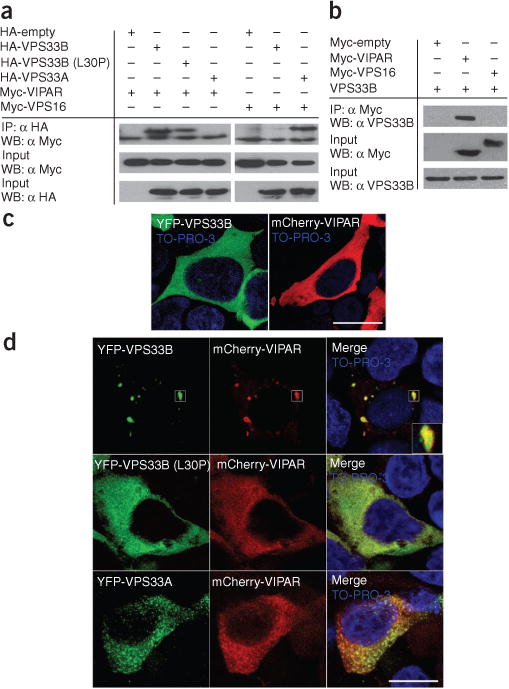
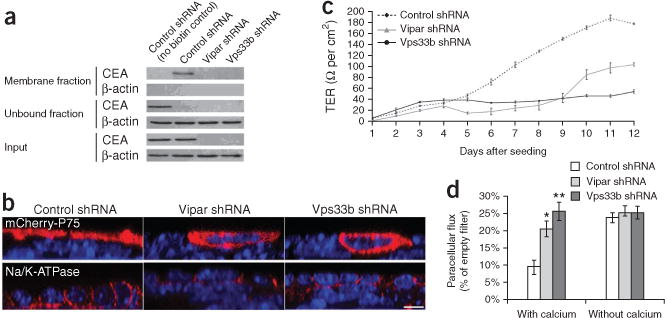
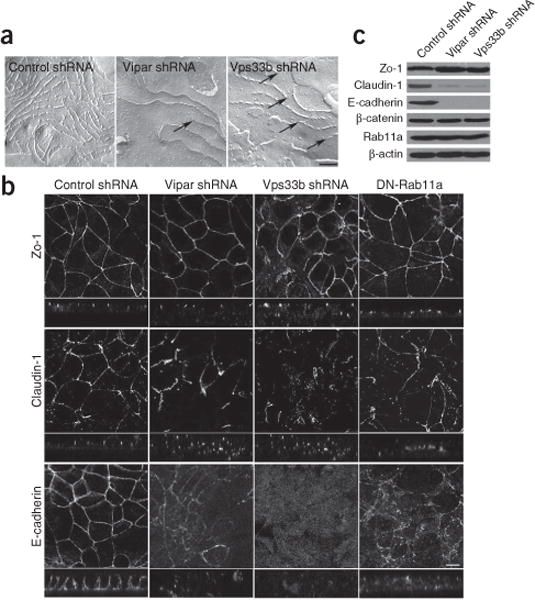
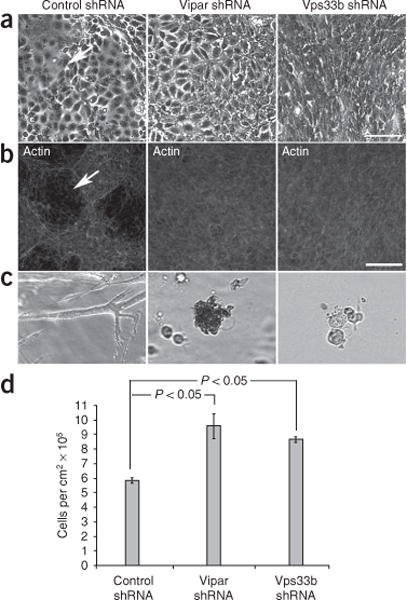
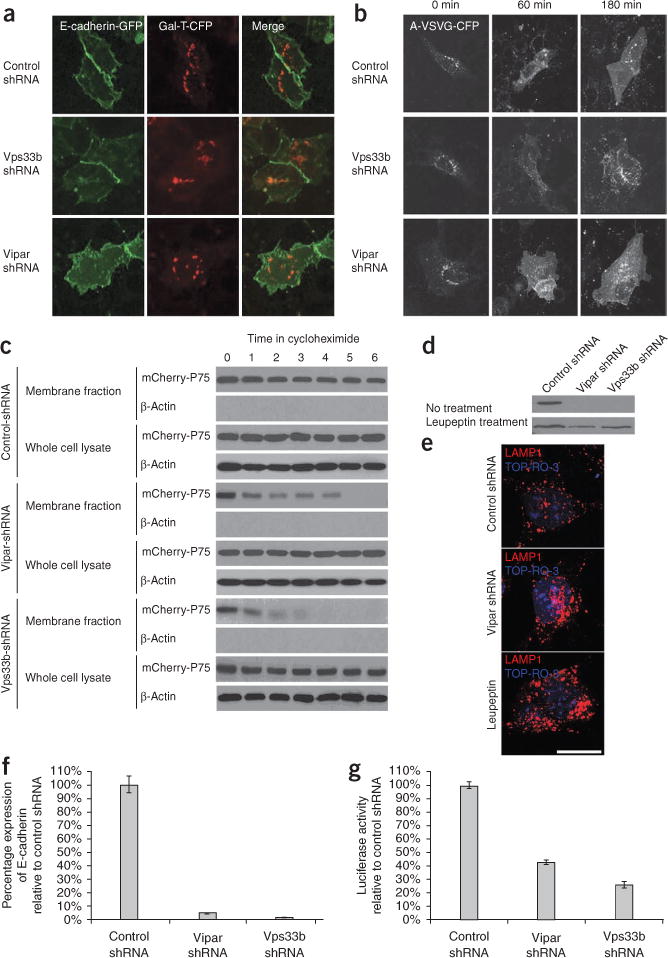
Arthrogryposis, renal dysfunction and cholestasis syndrome (ARC) is a multisystem disorder associated with abnormalities in polarized liver and kidney cells. Mutations in VPS33B account for most cases of ARC. We identified mutations in VIPAR (also called C14ORF133) in individuals with ARC without VPS33B defects. We show that VIPAR forms a functional complex with VPS33B that interacts with RAB11A. Knockdown of vipar in zebrafish resulted in biliary excretion and E-cadherin defects similar to those in individuals with ARC. Vipar- and Vps33b-deficient mouse inner medullary collecting duct (mIMDC-3) cells expressed membrane proteins abnormally and had structural and functional tight junction defects. Abnormal Ceacam5 expression was due to mis-sorting toward lysosomal degradation, but reduced E-cadherin levels were associated with transcriptional downregulation. The VPS33B-VIPAR complex thus has diverse functions in the pathways regulating apical-basolateral polarity in the liver and kidney.


Conflict of interest statement

The authors declare no competing financial interests.

Figures

Figure 1
Figure 1
VPS33B interacts with VIPAR. (a) HEK293 cells were co-transfected with hemagglutinin (HA)-tagged VPS33B, VPS33B (L30P) mutant or VPS33A and with Myc-tagged VIPAR or VPS16 constructs. Coimmunoprecipitation experiments showed that HA-VPS33B and HA-VPS33B (L30P) interact with Myc-VIPAR and that HA-VPS33A interacts with Myc-VPS16. No interaction was seen between HA-VPS33B and Myc-VPS16 or between HA-VPS33A and Myc-VIPAR. Quantification revealed that 28.6% ± 1.5% (s.e.m.) (VPS33B), 23.8% ± 0.8% (VPS33B-L30P) and 28.2% ± 1.1% (VPS33A) of the Myc-VIPAR or Myc-VPS16 input were recovered (n = 3, ± 1 s.e.m.). (b) HEK293 cells were transfected with either Myc-VIPAR or Myc-VPS16, and a coimmunoprecipitation experiment was carried out to assess for interaction with endogenous VPS33B. Again, VPS33B interacted with Myc-VIPAR but not with Myc-VPS16. (c,d) Confocal fluorescence photomicrographs of HEK293 cells transfected with YFP-VPS33B and mCherry-VIPAR constructs individually (c) or with both mCherry-VIPAR and YFP-VPS33B, YFP-VPS33B-L30P or YFP-VPS33A (d). Nuclei are stained with TO-PRO-3. Scale bars, 15 μm. Individual overexpression of VPS33B or VIPAR demonstrated generalized cytoplasmic distribution. When both are overexpressed, mCherry-VIPAR and YFP-VPS33B form cytoplasmic clusters. No clusters were seen when mCherry-VIPAR was overexpressed with YFP-VPS33B-L30P or HA-VPS33A.
Figure 2
Figure 2
Intrahepatic defects in individuals with ARC and in Vipar-deficient zebrafish larvae. (a) Immunohistochemical analysis of E-cadherin localization in an individual with ARC with VPS33B mutations and in control liver tissue (×400 and ×1,000 magnification; hematoxylin counterstain). Decreased amounts of E-cadherin can be seen at the apical junction complexes in the ARC sample compared with the control. Decreased E-cadherin expression was particularly obvious in hepatocytes cuffing portal tracts (arrow). (b) Lateral and ventral views of vipar in situ hybridization in 5 d post fertilization (d.p.f.) larvae using DIG-labeled antisense and sense (control) vipar probes. High expression in liver (L, outlined) and small intestine (arrow) is seen. (c) Brightfield and green fluorescence images of PED-6–treated non-injected (embryos) larvae and vipar ATG morpholino–injected 5-d.p.f. (embryos) larvae. Liver (white arrow), swimbladder (white arrowhead) and gallbladder samples (red arrowhead) are indicated. (d) A bar graph showing that the amount of PED6 detected in the gallbladder is significantly lower in ATG and exon 3 morpholino–injected larvae than in non-injected control larvae or exon 3–mismatch control larvae. Injecting vipar mRNA, but not an unrelated mRNA (RFP), after morpholino treatment rescued the phenotype (n = 90 for each treatment group (3 independent injections with 30 larvae in each clutch); error bars, ± 1 s.d., *P < 0.001 by z-test). (e) Immunostaining of 5-d.p.f. larvae livers for E-cadherin showing markedly reduced E-cadherin staining in morpholino-injected larvae compared with controls. Scale bars, 200 μm (b,c) or 10 μm (e).
Figure 3
Figure 3
Abnormal membrane polarization of mIMCD-3 cells in Vps33b and Vipar deficiencies. (a) Protein blotting of Ceacam5 (Cea) in biotinylated membrane fraction lysates and whole-cell lysate showing severe reduction of Cea in Vps33b shRNA and Vipar shRNA cells. The unbound fraction contains the unbiotinylated or nonmembrane proteins. (b) Confocal immunofluorescence photomicrographs of cultured cells treated with shRNA (control shRNA, Vipar shRNA and Vps33b shRNA); shown are xz plane images. Loss of apical distribution can be seen for transfected P75. The basolateral protein Na+-K+ ATPase (endogenous) is correctly localized in all three cell types. Nuclei are stained with TO-PRO-3. Scale bar, 10 μm. (c) Average TER readings every 24 h after seeding control and knockdown cells onto Transwell supports (n = 4, error bars, ± 1 s.e.m.). Maximum levels of resistance reached by the knockdown cells are ~50% reduced compared with controls. (d) Paracellular flux of 4 kDa dextran fluorescein isothiocyanate conjugate, with and without calcium in the medium, for all three cell types (n = 4, error bars, ± 1 s.e.m., *P < 0.05, **P < 0.001 by a Student’s t-test). Similar paracellular flux is achieved in control cells during ‘calcium switch’ experiments.
Figure 4
Figure 4
Both Vipar and Vps33b are required for apical junction complex formation. (a) Freeze-fracture images of control, Vipar knockdown and Vps33b knockdown cells showing tight junction strands (scale bar, 0.2 μm). In Vipar shRNA–treated cells and in Vps33b shRNA–treated cells, tight junctions revealed a strong decrease of tight junction strand complexity and/or a decrease of the P-face association, leading to interrupted and blindly ending strands (arrows), when compared with the control cells. Interruptions but no blind ends were seen in the control cells. This can also be seen in the E-face, where continuous networks of grooves with only rare blind ends can be seen (data not shown). (b) Confocal immunofluorescence photomicrographs in the xy and xz planes of zo-1, claudin-1 and E-cadherin in cells treated with control shRNA, Vps33b shRNA or Vipar shRNA and in cells with stable transfection of GDP-locked Rab11a mutant DN-Rab11a (scale bar, 10 μm). The knockdown cells do not grow in a monolayer with constant height, but instead grow partly on top of neighboring cells. Amounts of E-cadherin and, to a lesser extent, claudin-1 are reduced at adherens junctions and tight junctions. (c) Protein blotting shows results compatible with those from immunostaining, with decreased E-cadherin and claudin-1 levels in the knockdown cells. However, levels of another adherens junction protein, β-catenin, were the same as those in controls.
Figure 5
Figure 5
Abnormalities in cell morphology and growth in Vipar and Vps33b deficiencies. (a) Phase contrast images of cells treated with contro shRNA, Vps33b shRNA or Vipar shRNA growing on tissue culture dishes and showing disordered growth in knockdown cells (particularly obvious in Vps33b shRNA-treated cells). Cavitations are seen only in the control cells (arrow). (b) Control shRNA, Vps33b shRNA and Vipar shRNA cells grown on Transwell supports. (β-actin is stained with phalloidin-TRITC conjugate (scale bar, 100 μm). Cavitations (arrow) are present only in control cells. (c) mIMCD-3 cells growing in collagen gels (×10). Cells treated with control shRNA form highly branched tubules after 3 d in culture, whereas cells treated with Vipar shRNA or Vps33b shRNA cells form no tubules. (d) Numbers of cells harvested (mean) from Transwell supports using trypsin after 8 d in culture (n = 3, error bar, ± 1 s.e.m., P < 0.05 by t-test). Knockdown cell numbers are significantly greater than control cell numbers, compatible with loss of contact inhibition. Actual cell proliferation is likely underestimated for knockdown cells, in which ongoing spontaneous detachment led to loss into medium before harvesting.
Figure 6
Figure 6
The VPS33B-VIPAR complex interacts with RAB11A. (a) Confocal fluorescence photomicrographs of HEK293 cells cotransfected with HA-VPS33B (not immunostained), with mCherry-VIPAR and with green fluorescent protein (GFP)-tagged RAB11A (GFP-RAB11A) showing colocalization (inset). Scale bar, 15 μm. (b) Confocal immunofluorescence photomicrographs of mIMCD-3 cells stained for endogenous Rab11a (green) and Vps33b (red). Nuclei are stained with TO-PRO-3. Scale bar, 15 μm. Colocalization of both markers is seen (inset). (c) Coimmunoprecipitation of endogenous Vps33b and Rab11a from mIMCD-3 cells after pulldown with Rab11a antibody or Vps33b antibody. Control (IgG molecules) failed to pull down the relevant protein. (d) HEK293 cells were cotransfected with HA-tagged VPS33B or empty vector, Myc-VIPAR or empty vector, and GFP-RAB11A. Coimmunoprecipitation experiments using HA-VPS33B or Myc-VIPAR as bait show that both VPS33B and VIPAR immunoprecipitate in the same complex as RAB11A. Overexpression of both HA-VPS33B and Myc-VIPAR was necessary for interaction with GFP-RAB11A to occur. Quantification of immunoprecipitation revealed that 6.7% (for HA; IP α HA) and 7.9% (for Myc; IP α Myc) of the RAB11A input was recovered. When GFP-tagged dominant negative (DN) RAB11A was used, no interaction between the VPS33B-VIPAR complex and GDP-locked dominant negative RAB11A could be seen.
Figure 7
Figure 7
Investigation of the intracellular trafficking defects in Vps33b- and Vipar-deficient mIMCD-3 cells. (a) After transfection with E-cadherin-GFP and with Gal-T (a Golgi-resident protein) linked to CFP (Gal-T-CFP), cells were incubated overnight at 37 °C. Exogenously expressed E-cadherin targeted normally to the plasma membrane in the knockdown and control cells. (b) Cells were infected with apically targeted A-VSVG-CFP and incubated overnight at 40 °C. The cells were next incubated at 20 °C with cycloheximide (10 μg/ml) for 3 h and then, at t = 0, shifted to incubation at 32 °C. At t = 0, A-VSVG-CFP accumulated in the Golgi, but after the temperature switch, A-VSVG-CFP was trafficked normally to the plasma membrane in both knockdown cells and controls. (c) Membrane biotinylation assay showing reduced membrane mCherry-P75 content in the knockdown cell lines compared to the contro cells when incubated with cycloheximide. At t = 0, the membrane content of P75 was similar for all cell lines, suggesting no abnormality in post-Golgi trafficking of P75. No (β-actin was detected in the membrane fraction, and the whole-cell lysates contained mCherry-P75 in all samples. (d) Recovery of the Ceacam5 band after overnight treatment with leupeptin (lysosoma degradation inhibitor) is shown in cells treated with Vps33b shRNA or Vipar shRNA. (e) Lamp-1 immunofluorescent staining of wild-type mIMCD-3 cells, cells treated with Vipar shRNA and cells treated with both leupeptin and Vipar shRNA. Increased Lamp-1 immunostaining is seen in the knockdown cells. Scale bar, 15 μm. (f,g) Quantitative real-time PCR analysis of Cdh1 (E-cadherin) mRNA (f) and Cdh1 promoter activation (g) assessed by luciferase assay in knockdown and wild-type mIMCD-3 cells. Error bars, ± 1 s.e.m. In knockdown cells, mRNA levels were markedly reduced and promoter activity was decreased.

Comment in

Similar articles

Cited by

References

    1. Rodriguez-Boulan E, Nelson WJ. Morphogenesis of the polarized epithelial cell phenotype. Science. 1989;245:718–725. - PubMed
    1. Shin K, Fogg VC, Margolis B. Tight junctions and cell polarity. Annu Rev Cell Dev Biol. 2006;22:207–235. - PubMed
    1. Lubarsky B, Krasnow MA. Tube morphogenesis: making and shaping biological tubes. Cell. 2003;112:19–28. - PubMed
    1. Anderson JM, Van Itallie CM, Fanning AS. Setting up a selective barrier at the apical junction complex. Curr Opin Cell Biol. 2004;16:140–145. - PubMed
    1. Hartsock A, Nelson WJ. Adherens and tight junctions: structure, function and connections to the actin cytoskeleton. Biochim Biophys Acta. 2008;1778:660–669. - PMC - PubMed

Publication types