. 2010 Apr;11(4):350-4.
doi: 10.1038/ni.1850. Epub 2010 Feb 28.

Unique autoreactive T cells recognize insulin peptides generated within the islets of Langerhans in autoimmune diabetes

Affiliations

Unique autoreactive T cells recognize insulin peptides generated within the islets of Langerhans in autoimmune diabetes

James F Mohan et al. Nat Immunol. 2010 Apr.

Abstract

In addition to the genetic framework, there are two other critical requirements for the development of tissue-specific autoimmune disease. First, autoreactive T cells need to escape thymic negative selection. Second, they need to find suitable conditions for autoantigen presentation and activation in the target tissue. We show here that these two conditions are fulfilled in diabetic mice of the nonobese diabetic (NOD) strain. A set of autoreactive CD4(+) T cells specific for an insulin peptide, with the noteworthy feature of not recognizing the insulin protein when processed by antigen-presenting cells (APCs), escaped thymic control, participated in diabetes and caused disease. Moreover, APCs in close contact with beta cells in the islets of Langerhans bore vesicles with the antigenic insulin peptides and activated peptide-specific T cells. Our findings may be relevant for other cases of endocrine autoimmunity.


Figures
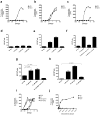
Figure 1
Figure 1
Insulin reactive T cells in NOD mice. (a–c) IL-2 production in response to insulin or B:9-23 peptide stimulation by three representative CD4+ T cell hybridomas using a standard CTLL proliferation bioassay. (a) ‘type B’ T cell (2D10), no response to insulin.(b) ‘type A’ T cell (4F7), equal response to insulin and peptide. (c) ‘type A’ T cell (IIT-9) very poor response to insulin. (d) ELISPOT of IL-2 production in NOD mice immunized with insulin and re-stimulated with insulin or the B:9-23 peptide. Results represent number of IL-2 secreting cells per 106 draining lymph node cells. SFC, spot forming cells. (e) ELISPOT of IL-2 secretion in NOD mice immunized with B:9-23 peptide and restimulated with peptide or insulin. (f) ELISPOT of IL-2 secretion in NOD mice immunized with B:9-23 peptide and restimulated with peptide in the presence of specific (anti-I-Ag7) blocking antibody. (g) ELISPOT of IL-2 secretion in B16:A-dKO mice immunized with insulin and re-stimulated as indicated. (h) ELISPOT of IL-2 secretion in B16:A-dKO mice immunized with B:9-23 peptide and re-stimulated as indicated. (i) IL-2 production in two T cell hybridomas derived from the B16:A-dKO mice(#118 & # 22) and two hybridomas derived from NOD mice (4F7 & 4E4-62) in response to insulin presented by the C3.G7 cell line. (j) IL-2 production in ‘type A’ (4F7) and ‘type B’ (2D10 &10F9) hybridomas incubated with the C3.G7 cell line bearing a B:9-23 peptide-I-Ag7 covalent complex. P values in experiments were determined using one-tailed unpaired Student’s t test. Error bars, s.e.m.
Figure 2
Figure 2
‘Type B’ T cells are diabetogenic. (a) Diabetes incidence of three representative ‘type B’ T cell lines, when transferred into NOD.SCID recipients ( n=3 for each); mice were considered diabetic after two consecutive blood glucose readings of ≥ 250 mg/dl. (b) Cytokine profile of representative CD4+ T cell lines 48 h post stimulation with plate bound anti-CD3/CD28 antibodies. Haematoxylin and eosin stained pancreatic section of a NOD.SCID recipient that received 6D8 T cells and developed insulitis but not diabetes (c) and a NOD.SCID recipient that received 3E6 T cells and developed overt diabetes (d).
Figure 3
Figure 3
Intra-islet DC pulsed with secretory granules, present insulin peptides. (a) B:9-23 peptide presentation by a panel of cells from various tissues to a ‘type B’ hybridoma (Hyb #1.7). (b) IL-2 production from ‘type A’ (4E4-62) and ‘type B’ (2D10) hybridomas stimulated with dispersed islets from NOD.Rag1−/− mice. (c) IL-2 secretion from ‘type A’ (4E4-62) and ‘type B’ (2D10) hybridomas stimulated with CD11c+ cells isolated from the islets of 8 week old NOD males. (d) Electron microscopy analysis of Flt-3L CD11c+ cell coincubated with NIT-1 insulinoma cells for 24 h (arrows highlight granules in DC). Scale bar 500 ηm. (e,f) IL-2 production from ‘type B’ (2D10) (e) and ‘type A’ (4F7) (f) hybridomas stimulated with Nit-1 cells co-incubated with purified splenic CD11c+ DCs. (g) IL-2 production in ‘type A’ (4F7) and ‘type B’ (2D10 and Hyb #1.7) hybridomas stimulated with splenic CD11c+ cells co-incubated with purified insulin granules from primary dispersed islet cells. Error bars, s.e.m.
Figure 4
Figure 4
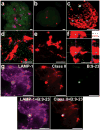
Secretory granules contain proteolytic fragments of the insulin β-chain in NOD.Rag1 −/− islets. (a) Immunofluorescence analysis at low magnification (20X) of an islet stained for CD11c+ (red) and intracellular B:9-23 (green). (b) Immunofluorescence analysis of an islet stained for CD11c+ (red) and B:9-23 (green) in the presence of competing exogenous B:9-23 peptide. Scale bars, 20μm. (c) Confocal microscopy of an isolated beta cell, stained for B:9-23 (green) and insulin (red). The reconstruction is from a single stack (1.5μm thickness). Scale bar, 15μm. (d, e) Reconstruction from a stack of 60 compiled optical sections acquired in 0.5-μm increments stained for CD11c+ (red) and intracellular B:9-23 (green) in the absence (d) or presence of competing B:9-23 free peptide (e). Scale bars, 20μm.. (f) Three-dimensional reconstruction of an islet by confocal microscopy stained for CD11c+ (red) and intracellular B:9-23 (green). The bottom left image is a projection along the z-axis (top view) from a stack of 30 optical sections acquired in 0.5μm increments. The top and right-sided images are zx- and zy-reconstructions (side view) of the same image stack (indicated as white lines). B:9-23 staining in the islet DC (yellow merge). Scale bar, 20μm. (g) Reconstruction of an isolated islet DC co-stained for B:9-23, class II MHC and for LAMP-1. Images represent a single stack with thickness of 1.5μm. Scale bars, 10μm.

Similar articles

Cited by

References

    1. Anderson MS, Bluestone JA. The NOD mouse: a model of immune disregulation. Annu Rev Immunol. 2005;23:447–485. - PubMed
    1. Zhang L, Nakayama M, Eisenbarth GS. Insulin as an autoantigen in NOD/human diabetes. Curr Opin Immunol. 2008;20:111–118. - PMC - PubMed
    1. Wegmann DR, Norbury-Glaser M, Daniel D. Insulin-specific T cells are a predominant component of islet infiltrates in pre-diabetic NOD mice. Eur J Immunol. 1994;24:1853–1857. - PubMed
    1. Wegmann DR, Gill RG, Norbury-Glaser M, Schloot N, Daniel D. Analysis of the spontaneous T cell response to insulin in NOD mice. J Autoimmun. 1994;7:833–843. - PubMed
    1. Daniel D, Gill RG, Schloot N, Wegmann D. Epitope specificity, cytokine production profile and diabetogenic activity of insulin-specific T cell clones isolated from NOD mice. Eur J Immunol. 1995;25:1056–1062. - PubMed

Publication types