. 2010 Apr;11(4):335-43.
doi: 10.1038/ni.1847. Epub 2010 Feb 28.

An Slfn2 mutation causes lymphoid and myeloid immunodeficiency due to loss of immune cell quiescence

Affiliations

An Slfn2 mutation causes lymphoid and myeloid immunodeficiency due to loss of immune cell quiescence

Michael Berger et al. Nat Immunol. 2010 Apr.

Abstract

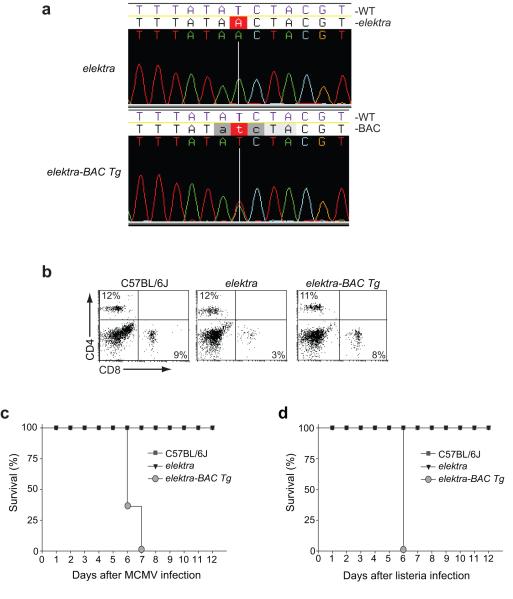
Here we describe a previously unknown form of inherited immunodeficiency revealed by an N-ethyl-N-nitrosourea-induced mutation called elektra. Mice homozygous for this mutation showed enhanced susceptibility to bacterial and viral infection and diminished numbers of T cells and inflammatory monocytes that failed to proliferate after infection and died via the intrinsic apoptotic pathway in response to diverse proliferative stimuli. They also had a greater proportion of T cells poised to replicate DNA, and their T cells expressed a subset of activation markers, suggestive of a semi-activated state. We positionally ascribe the elektra phenotype to a mutation in the gene encoding Schlafen-2 (Slfn2). Our findings identify a physiological role for Slfn2 in the defense against pathogens through the regulation of quiescence in T cells and monocytes.


Figures

Figure 1
Figure 1. Homozygous elektra mutants are highly susceptible to MCMV, LCMV and L. monocytogenes infections
(a) Survival curves for WT (n=8) and homozygous elektra mutants (n=8) upon challenge with 2 × 10⁵ PFU of MCMV. Results are representative of five independent experiments. (b) Survival curves upon infection with 2 × 10⁵ PFU of MCMV after reciprocal bone marrow transplantation. Recipient mice were reconstituted with 5 × 10⁶ bone marrow cells 1 day after 10-Gy dose of irradiation. Congenic C57BL/6.SJL (PtprcaPep3b; Ly5.1+), C57BL/6J (PtprcbPep3a; Ly5.2+) WT or elektra mutant mice were used as both recipients and donors as indicated in the figure. C57BL/6J into C57BL/6J, n=3; C57BL/6J into elektra, n=6; elektra into C57BL/6J, n=6; elektra into elektra, n=3. Results are representative of 2 independent experiments. (c) WT and homozygous elektra mice (3 mice in each group) were i.v. injected with either 200 or 2 × 10⁶ PFU of LCMV (Armstrong strain). Viral load was measured in spleens 7 days after injection. Results are representative of two independent experiments. ** P < 0.0001, *P = 0.028. (d) Survival curves for WT (n=5), homozygous elektra (n=7), and Myd88poc/poc (n=2) mice when challenged with 2 × 10⁵ CFU of Listeria monocytogenes. Results are representative of four independent experiments.
Figure 2
Figure 2. Defect in peripheral T cells in elektra homozygotes
(a) Cells from spleen, lymph node (LN), and blood of WT or homozygous elektra mice were analyzed by flow cytometry for CD4 and CD8 expression. (b) Thymocytes from WT or homozygous elektra mice were analyzed by flow cytometry for CD4 and CD8 expression. For a and b, results are representative of 10 mice per genotype. (c) WT and homozygous elektra mice were i.v. injected with either 200 or 2 × 10⁶ PFU of LCMV (Armstrong strain). Splenocytes were isolated 7 days post-injection and restimulated ex vivo with either GP33 or NP396, peptides derived from LCMV, in the presence of Brefeldin A. Total numbers of CD8+ splenocytes were determined by flow cytometry (top). CD8+ cells were then fixed, permeabilized, and stained for intracellular IFN-γ expression (bottom). n=3 mice of each genotype per condition. Results are representative of 2 independent experiments. *** P < 0.001, ** P < 0.01.
Figure 3
Figure 3. Apoptosis of homozygous elektra T cells in response to activation signals
(a) CFSE intensity of CD8+ lymph node cells that were treated as indicated. Results are representative of 3 mice per genotype. (b) Left, BrdU incorporation measured by flow cytometry of CD8+ T cells from WT or elektra mice (n=3 each) that were either untreated, or stimulated with anti-CD3ε and anti-CD28. Results are representative of two experiments. Right, BrdU incorporation measured by flow cytometry of CD8+ T cells from WT or elektra mice (n=4 each) 4 h after injection with BrdU. Results are representative of two experiments. (c) Propidium iodide versus Annexin V staining of CD8+ T cells from WT or elektra mice (n=3 each) stimulated ex vivo with anti-CD3ε and anti-CD28 for 48 h. Results are representative of two experiments. (d) Percentage of Annexin V+ cells (gated on CD8+ propidium iodide negative population) induced by γ-irradiation (n=3 mice each). (e) Immunoblot analysis (top) and flow cytometric analysis (bottom) using anti-phospho-p38-MAPK or anti-p38-MAPK of pooled CD8+ T cells from WT (n=2) or elektra (n=4) mice upon anti-CD3ε and anti-CD28 treatment. Results are representative of 3 mice per genotype. For all panels, *** P < 0.001, ** P < 0.01, * P < 0.05.
Figure 4
Figure 4. Apoptosis of homozygous elektra T cells in response to homeostatic expansion signals
(a) Annexin V staining of adoptively transferred WT or elektra CD8+CD45.1 cells from spleens of WT (Ly5.1+) recipient mice (n=4). Results are representative of three experiments. (b) Relative % of CD8+ (top) or CD4+ (bottom) T cells in seven week-old WT or elektra mice (n=5 or 6 respectively) at different time points after thymectomy. Relative % of T cells = (% T cells after thymectomy)/ (% T cells before the thymectomy). Results are representative of two experiments. (c) Numbers of CD8+, CD4+, B cells, and percentage of Annexin V positive CD8+ T cells in spleens from elektra or WT mice (n=4 each) injected with either PBS, or IL-7/anti-IL-7 (M25). White and black bars, mice injected with either PBS or IL-7/anti-IL-7 respectively on days 1 and 3 and cells collected on day 6; gray bars, mice injected with IL-7/anti-IL-7 on day 1 and cells collected on day 3. Results are representative of two experiments. (d) Annexin V staining of splenic CD8+CD44hi or CD8+CD44lo cells from WT or elektra mice (n=4 each). Results are representative of 3 experiments. For all panels, *** P < 0.001, ** P < 0.01, * P < 0.05.
Figure 5
Figure 5. Homozygous elektra T cells die via the intrinsic apoptotic pathway
(a) Elektra mutant mice were crossed to Faslpr/lpr mutant mice to generate double mutant elektra (eka/eka); Faslpr/lpr mice. Shown, CD4 versus CD8 staining of blood cells from 6 week-old littermate mice. (b) Bcl-2 expression in splenic CD8+CD44hi or CD8+CD44lo cells from WT or homozygous elektra mice analyzed by flow cytometry. (c) Elektra mutant mice were crossed to Tg(BCL2)25Wehi/J transgenic mice to generate homozygous elektra mice overexpressing Bcl2 in T cells. CD4 versus CD8 staining of splenic cells from 4 week-old littermate mice. (d) CFSE-labeled spleen cells from mice used in c were stimulated in vitro with a combination of anti-CD3ε and anti-CD28. Cells were collected after 72 h and CFSE intensity of the CD3+ CD8+ cells was analyzed by flow cytometry. For all panels, results are representative of 2 independent experiments each using 3–4 mice per genotype.
Figure 6
Figure 6. Homozygous elektra T cells exist in a semi-activated state
(a) Flow cytometric analysis of CD44 versus CD122 (IL-2Rβ) staining of splenic CD8+ cells from WT or elektra mice injected twice (one dose every 3 days) with either PBS or IL-7/anti-IL-7 (n=3 per genotype). Results are representative of two experiments. (b) Flow cytometric analysis of IL-7Rα, CD62L, CD5, CD69, and PD-1 staining of CD44loCD8+ or CD44hiCD8+ cells. ISM, isotype-matched control antibody (n=3 per genotype). Results are representative 3 experiments. (c) CD44 versus CD122 staining of splenic CD8+ cells from 4 week-old elektra/+;Bcl2(Tg), elektra/elektra;Bcl2(Tg), elektra or WT littermate mice (n=3 each). (d) CD62L staining of spleen CD44loCD8+ or CD44hiCD8+ cells from elektra/+;Bcl2(Tg) and elektra/elektra;Bcl2(Tg) mice (n=3 each). For c and d results are representative of two experiments. (e,f) Flow cytometric analysis of WT (CD45.1+) and elektra (CD45.2+) donor CD8+ T cells in CD3-deficient mixed bone marrow chimeras. (e) CD44 versus CD122 staining. (f) CD62L staining of CD44loCD8+ or CD44hiCD8+ cells. Top, representative flow cytometry plots. Bottom, averaged mean fluorescence intensity (MFI) of CD62L staining in the CD44lo population; and percentages of CD62Lhi and CD62Llo expressing cells in the CD44hi population. For e and f, n=6 recipient mice, *** P < 0.001.
Figure 7
Figure 7. Apoptosis of homozygous elektra monocytes in response to activation signals
(a) Left, Ly6C versus CD11b staining of splenocytes from uninfected or L. monocytogenes infected WT or elektra mice (n=5 per genotype). Percentages of inflammatory monocytes and neutrophils are indicated by R1 and R2 gated cell populations, respectively. Results are representative of 3 experiments. Right, average percentage of inflammatory monocytes 48 h post-infection from spleen, blood, and bone marrow of WT or elektra mice (n=5 each). (b) Flow cytometric analysis of WT (CD45.1+) and elektra (CD45.2+) donor CD4+, CD8+, B cells (B220+), and inflammatory monocytes (gated on CD11b+ population) in the blood of CD3-deficient mixed bone marrow chimeras (n=3). Results are representative of two experiments. (c–e) Isolated bone marrow inflammatory monocytes from WT or elektra mice (n=2 each) cultured for 3 days in medium (untreated) or in medium supplemented with IFN-γ and heat-killed L. monocytogenes (treated). (c) Top, MHC class II staining. Bottom, nitric oxide concentration. (d) Forward-scatter (FSC) versus side-scatter (SSC) profile. Populations of live and dead cells are indicated. (e) Annexin V staining of the gated high FSC population. Results are representative of three experiments. For all panels, *** P < 0.001, ** P < 0.01, * P < 0.05. NS, not significant.
Figure 8
Figure 8. Rescue of the elektra phenotype by BAC transgenesis
Transgenic mice were produced by microinjecting a BAC clone containing the wild-type Slfn2 sequence into single-cell embryos homozygous for the elektra mutation. (a) DNA sequence of the BAC clone and genomic DNA from an elektra homozygote in the region of the Slfn2elektra mutation. The BAC clone contains the wild-type Slfn2 sequence. (b) Flow cytometric analysis of CD8 and CD4 staining of blood from a WT mouse, a homozygous elektra transgenic mouse carrying the Slfn2 transgene (elektra-BAC Tg), and a littermate lacking the transgene (elektra). Results are representative of 4 mice per genotype. (c) Survival curves for transgenic mice (elektra-BAC Tg, n=7), littermates without the transgene (elektra, n=4), and WT mice (n=5) upon challenge with 2 × 10⁵ PFU of MCMV. (d) Survival curves for transgenic mice (elektra-BAC Tg, n=7), littermates without the transgene (elektra, n=5), and WT mice (n=7) upon challenge with 5 × 10⁵ CFU of L. monocytogenes.

Comment in

  • Quieting T cells with Slfn2.
    Horton MR, Powell JD. Horton MR, et al. Nat Immunol. 2010 Apr;11(4):281-2. doi: 10.1038/ni0410-281. Nat Immunol. 2010. PMID: 20300134 Free PMC article. Review.

References

    1. Yusuf I, Fruman DA. Regulation of quiescence in lymphocytes. Trends Immunol. 2003;24:380–386. - PubMed
    1. Chechlinska M, et al. Molecular signature of cell cycle exit induced in human T lymphoblasts by IL-2 withdrawal. BMC Genomics. 2009;10:261. - PMC - PubMed
    1. Coller HA, Sang L, Roberts JM. A new description of cellular quiescence. PLoS Biol. 2006;4:e83. - PMC - PubMed
    1. Glynne R, Ghandour G, Rayner J, Mack DH, Goodnow CC. B-lymphocyte quiescence, tolerance and activation as viewed by global gene expression profiling on microarrays. Immunol. Rev. 2000;176:216–246. - PubMed
    1. Teague TK, et al. Activation changes the spectrum but not the diversity of genes expressed by T cells. Proc. Natl. Acad. Sci. USA. 1999;96:12691–12696. - PMC - PubMed

Publication types

Substances