. 2010 Apr;6(4):291-9.
doi: 10.1038/nchembio.332. Epub 2010 Feb 28.

A chemical and phosphoproteomic characterization of dasatinib action in lung cancer

Affiliations

A chemical and phosphoproteomic characterization of dasatinib action in lung cancer

Jiannong Li et al. Nat Chem Biol. 2010 Apr.

Abstract

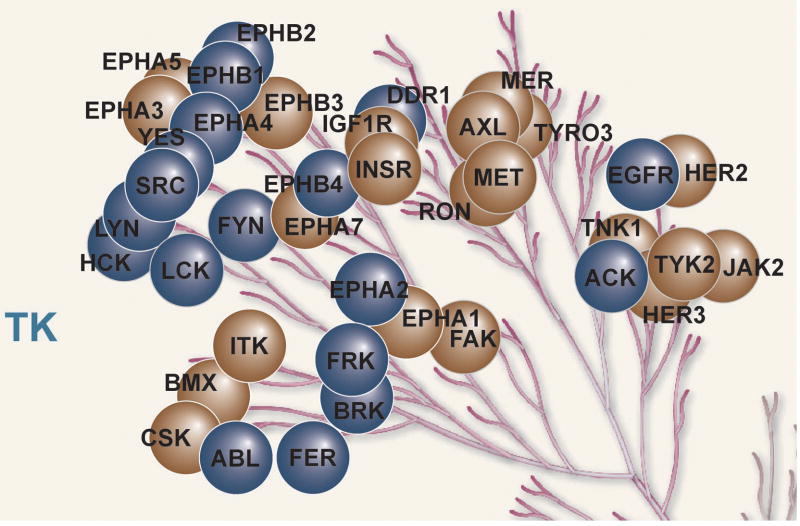
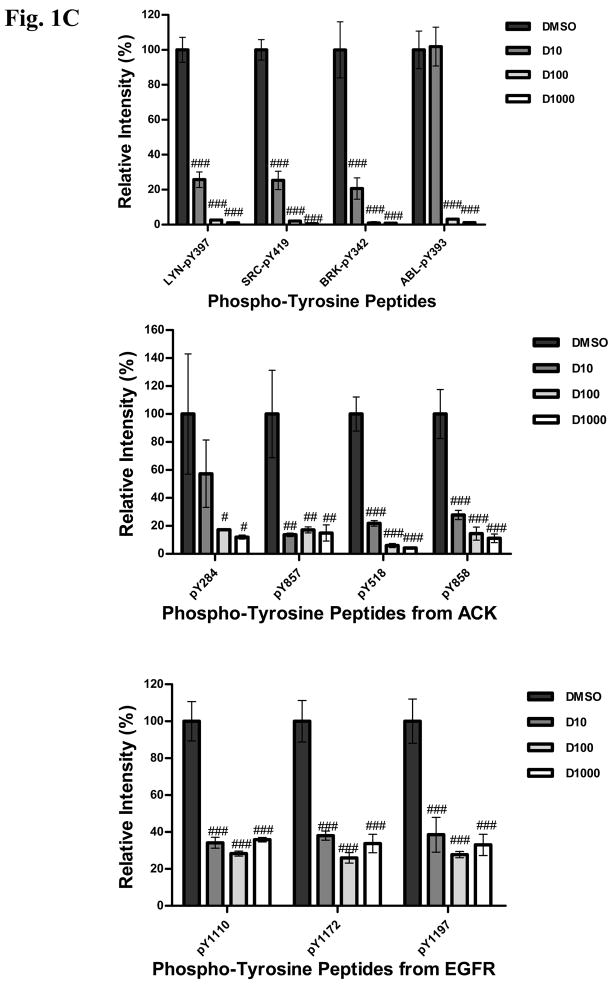
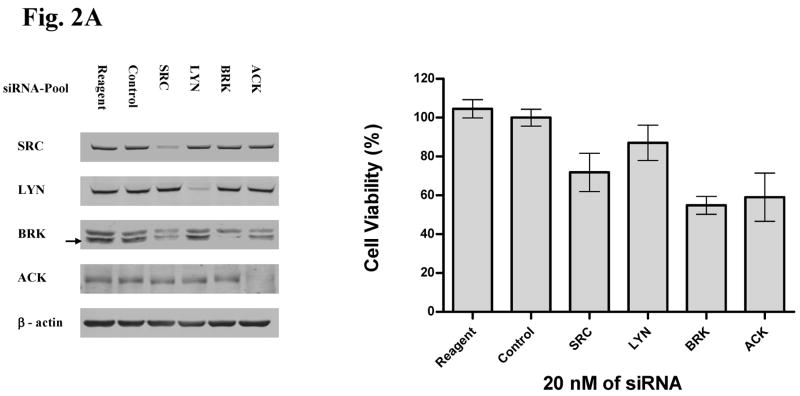
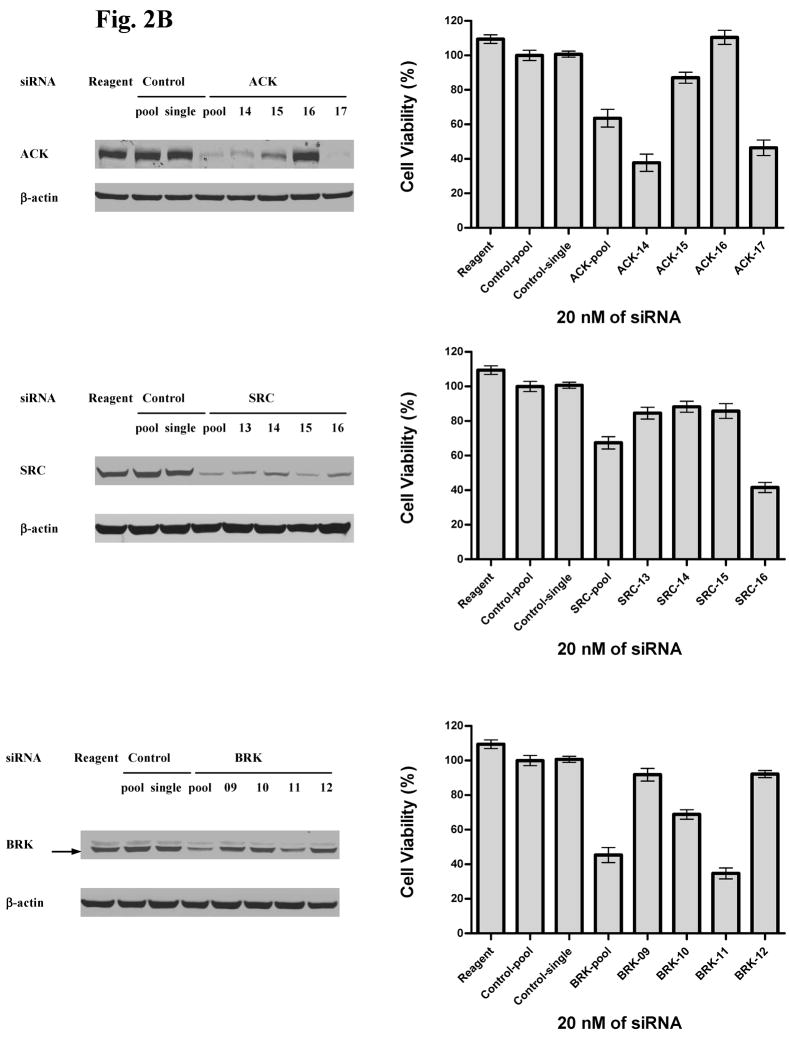
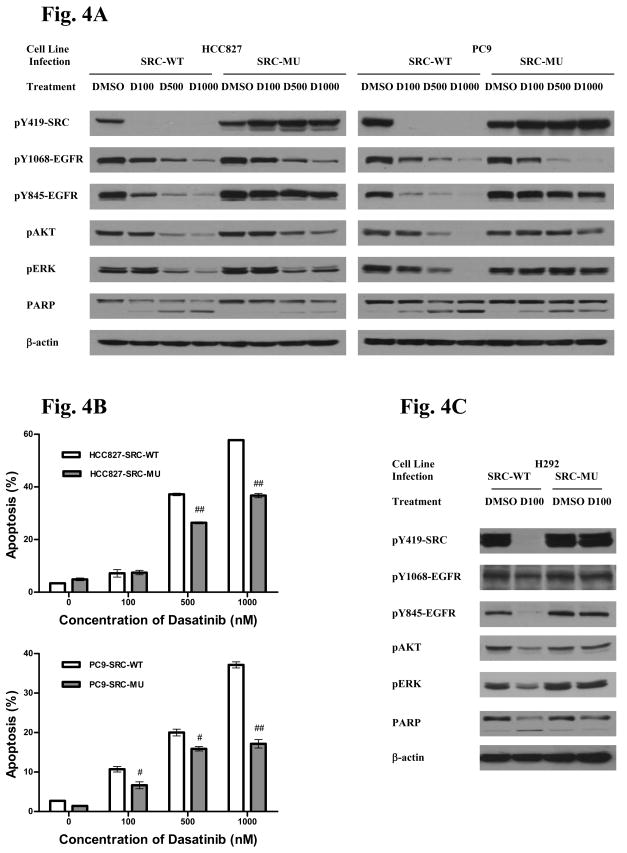
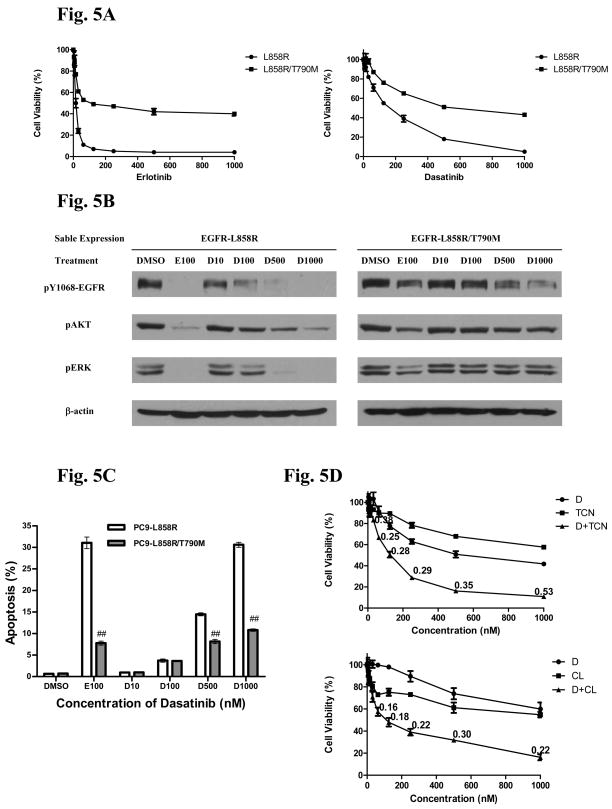
We describe a strategy for comprehending signaling pathways that are active in lung cancer cells and that are targeted by dasatinib using chemical proteomics to identify direct interacting proteins combined with immunoaffinity purification of tyrosine-phosphorylated peptides corresponding to activated tyrosine kinases. We identified nearly 40 different kinase targets of dasatinib. These include SRC-family kinase (SFK) members (LYN, SRC, FYN, LCK and YES), nonreceptor tyrosine kinases (FRK, BRK and ACK) and receptor tyrosine kinases (Ephrin receptors, DDR1 and EGFR). Using quantitative phosphoproteomics, we identified peptides corresponding to autophosphorylation sites of these tyrosine kinases that are inhibited in a concentration-dependent manner by dasatinib. Using drug-resistant gatekeeper mutants, we show that SFKs (particularly SRC and FYN), as well as EGFR, are relevant targets for dasatinib action. The combined mass spectrometry-based approach described here provides a system-level view of dasatinib action in cancer cells and suggests both functional targets and a rationale for combinatorial therapeutic strategies.


Figures

Figure 1
Figure 1. Protein kinase targets of dasatinib in lung cancer cells identified by chemical and phosphoproteomics
A. H292, H441 and HCC827 cell pellets were lysed and dasatinib-bound proteins were identified using c-dasatinib affinity matrixes and LC-MS/MS as described in Materials and Methods. The key for each cell line is listed in bottom left corner. Human Kinome reproduced courtesy of Cell Signaling Technology www.cellsignal.com B. H292 cells were exposed to increasing concentrations of dasatinib for 3 hr after which purified pY peptides were identified and quantified. Tyrosine kinases demonstrating reduced levels of pY peptides are shown in blue circles and those showing no changes are shown in brown circles. C: Effects of increasing concentration of dasatinib (10, 100, 1000 nM) on individual pY peptide amount is shown for selected targets. Y axis indicates intensity of individual peptides normalized to DMSO control. # = P<0.05; ## = P<0.01 and ### = P<0.001 using the Students T- test.
Figure 2
Figure 2. Effects of siRNA mediated knockdown of SRC, LYN, BRK, and ACK on lung cancer cell viability
A. In left panel, H292 cells were exposed to indicated siRNA molecules for 72 hr and western analysis used to determine target modulation. Reagent = transfection reagents without siRNA, control siRNA = mismatch siRNA with transfection reagents. Arrow indicates BRK band at appropriate molecular weight compared to non-specific upper band. In right panel, effects of indicated siRNA on cell viability were assessed after 12 days. Results were normalized to reagent-only treated cells and error bars represent standard deviation. B. H292 cells were exposed to indicated siRNA molecules and effects on target modulation and cell viability assessed. Reagent = transfection reagents without siRNA, pool = 4 individual siRNA combined with final concentration of 20 nM, single = single siRNA molecule, numbers represent individual siRNA against indicated targets, control = mismatch siRNA. β-actin was used to ensure equal loading for western blotting. In right panel, effects of indicated siRNA on cell viability was assessed after 12 days. Results were normalized to reagent-only treated cells and error bars represent standard deviation.
Figure 3
Figure 3. Rescue effects of dasatinib target gatekeeper mutants on lung cancer cell viability
HCC827 cells were infected with lentivirus expressing wildtype and mutant gatekeeper form of each indicated target for 48 hr. Subsequently cells were exposed to increasing concentrations of dasatinib for 120 hr after which cell viability was assessed. Cell viability as a function of dasatinib concentration is plotted with error bars representing standard deviation and results normalized to DMSO treated cells.
Figure 4
Figure 4. Effects of SRC gatekeeper mutation on downstream signaling and apoptosis
A. HCC827 and PC9 cells were infected with lentiviruses expressing either wildtype SRC or SRC gatekeeper mutant. Cells were exposed to indicated concentrations of dasatinib(D), for example D100 = 100 nM of dasatinib, for 24 hr and protein lysates used for western analysis with indicated antibodies. DMSO = solvent control. B HCC827 and PC9 cells were infected with lentiviruses expressing either wildtype SRC or SRC gatekeeper. Cells were exposed to indicated concentrations of dasatinib for 60 hr and apoptosis assayed using cleaved-caspase-3. Results indicate mean ± SD. # = P<0.01 and ## = P<0.001 using the Students T-test. C. H292 cells were infected with lentiviruses expressing either wildtype SRC or SRC gatekeeper mutant. Cells were exposed to 100 nM of dasatinib for 24 hr and protein lysates used for western analysis with indicated antibodies.
Figure 5
Figure 5. Effects of EGFR gatekeeper mutation on downstream signaling and apoptosis
A. PC9 cells expressing either L858R EGFR or L858R/T790M EGFR were exposed to indicated concentrations of dasatinib (D) or erlotinib (E) for 120 hr and cell viability was accessed. Cell viability was normalized to untreated cells and error bars represent standard deviation. B PC9 cells expressing either L858R EGFR (left panel) or L858R/T790M EGFR (right panel) were exposed to indicated concentrations of erlotinib (E) or dasatinib (D) for 24 hr. Protein lysates were transferred to membranes and probed with indicated antibodies. C. PC9 cells expressing either L858R EGFR or L858R/T790M EGFR were exposed to indicated concentrations of dasatinib for 60 hr and apoptosis assayed using cleaved-caspase-3. Results indicate mean ± SD. # = P<0.01 and ## = P<0.001 using the Students T-test. D. PC9 cells expressing L858R/T790M EGFR were exposed to indicated concentrations of dasatinib (D), tricirabine (TCN), or the combination for 120 hr after which cell viability was assessed. A parallel group of cells were exposed to indicated concentrations of dasatinib (D), CL-387,785 (CL), or the combination for 120 hr after which cell viability was assessed. Values at each data point indicate combination index calculated by Chou-Talaly approach.

References

    1. Blume-Jensen P, Hunter T. Oncogenic kinase signalling. Nature. 2001;411:355–65. - PubMed
    1. Paez JG, Janne PA, Lee JC, et al. EGFR mutations in lung cancer: correlation with clinical response to gefitinib therapy. Science. 2004;304:1497–500. - PubMed
    1. Lynch TJ, Bell DW, Sordella R, et al. Activating mutations in the epidermal growth factor receptor underlying responsiveness of non-small-cell lung cancer to gefitinib. N Engl J Med. 2004;350:2129–39. - PubMed
    1. Puri N, Khramtsov A, Ahmed S, et al. A selective small molecule inhibitor of c-Met, PHA665752, inhibits tumorigenicity and angiogenesis in mouse lung cancer xenografts. Cancer Res. 2007;67:3529–34. - PubMed
    1. Song L, Morris M, Bagui T, Lee FY, Jove R, Haura EB. Dasatinib (BMS-354825) selectively induces apoptosis in lung cancer cells dependent on epidermal growth factor receptor signaling for survival. Cancer Res. 2006;66:5542–8. - PubMed

Publication types

MeSH terms