Consumption and response output as a function of unit price: manipulation of cost and benefit components
- PMID: 20190922
- PMCID: PMC2741056
- DOI: 10.1901/jaba.2009.42-609
Consumption and response output as a function of unit price: manipulation of cost and benefit components
Abstract
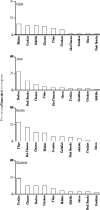
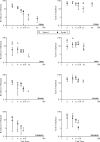
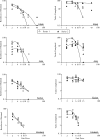
We conducted preference assessments with 4 typically developing children to identify potential reinforcers and assessed the reinforcing efficacy of those stimuli. Next, we tested two predictions of economic theory: that overall consumption (reinforcers obtained) would decrease as the unit price (response requirement per reinforcer) increased and that the cost and benefit components that defined unit price would not influence overall consumption considerably when unit price values were equal. We tested these predictions by arranging unit price such that the denominator was one (e.g., two responses produced one reinforcer) or two (e.g., four responses produced two reinforcers). Results showed that consumption decreased as unit price increased and that unit price values with different components produced similar consumption.
Keywords: behavioral economics; costs and benefits; preference assessment; reinforcer demand; unit price.
Figures


Similar articles
-
Unit price as a useful metric in analyzing effects of reinforcer magnitude.J Exp Anal Behav. 1993 Nov;60(3):641-66. doi: 10.1901/jeab.1993.60-641. J Exp Anal Behav. 1993. PMID: 8283154 Free PMC article.
-
Three predictions of the economic concept of unit price in a choice context.J Exp Anal Behav. 2000 Jan;73(1):45-64. doi: 10.1901/jeab.2000.73-45. J Exp Anal Behav. 2000. PMID: 10682339 Free PMC article.
-
Labor supply and consumption of food in a closed economy under a range of fixed- and random-ratio schedules: tests of unit price.J Exp Anal Behav. 2005 Mar;83(2):99-118. doi: 10.1901/jeab.2005.32-04. J Exp Anal Behav. 2005. PMID: 15828589 Free PMC article.
-
Revealed preference between reinforcers used to examine hypotheses about behavioral consistencies.Behav Modif. 2000 Jul;24(3):411-24. doi: 10.1177/0145445500243007. Behav Modif. 2000. PMID: 10881385 Review.
-
Behavioral economics of drug self-administration. I. Functional equivalence of response requirement and drug dose.Life Sci. 1990;47(17):1501-10. doi: 10.1016/0024-3205(90)90178-t. Life Sci. 1990. PMID: 2250566 Review.
References
-
- Allison J.W. Behavioral economics. New York: Praeger; 1983.
-
- Bickel W.K, Madden G.J. A comparison of measures of relative reinforcing efficacy and behavioral economics: Cigarettes and money in smokers. Behavioural Pharmacology. 1999;10:627–737. - PubMed
-
- Bickel W.K, Marsch L.A, Carroll M.E. Deconstructing relative reinforcing efficacy and situating the measures of pharmacological reinforcement with behavioral economics: A theoretical proposal. Psychopharmacology. 2000;153:44–56. - PubMed
MeSH terms
LinkOut - more resources
Full Text Sources

