. 2009 Sep 23;19(18):2943-2949.
doi: 10.1002/adfm.200900763.

Fabrication of Microbeads with a Controllable Hollow Interior and Porous Wall Using a Capillary Fluidic Device

Affiliations

Fabrication of Microbeads with a Controllable Hollow Interior and Porous Wall Using a Capillary Fluidic Device

Sung-Wook Choi et al. Adv Funct Mater. .

Abstract

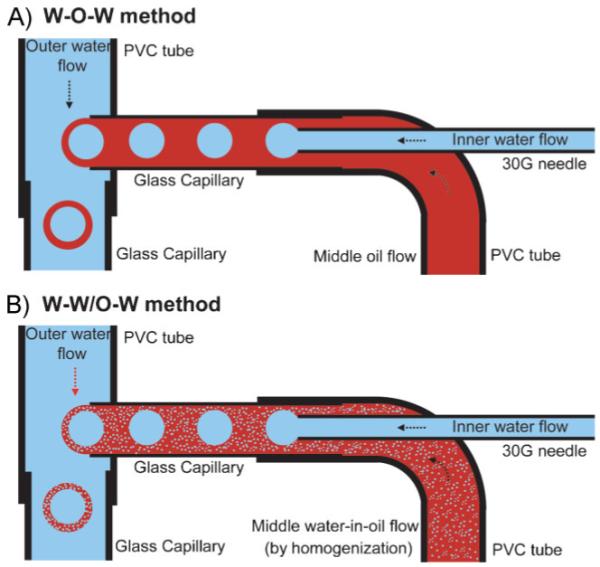
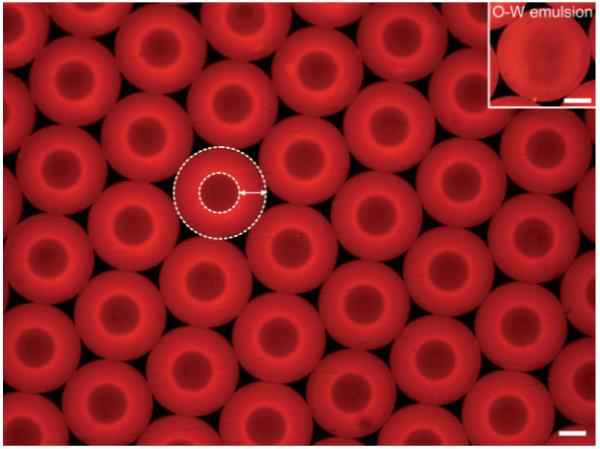
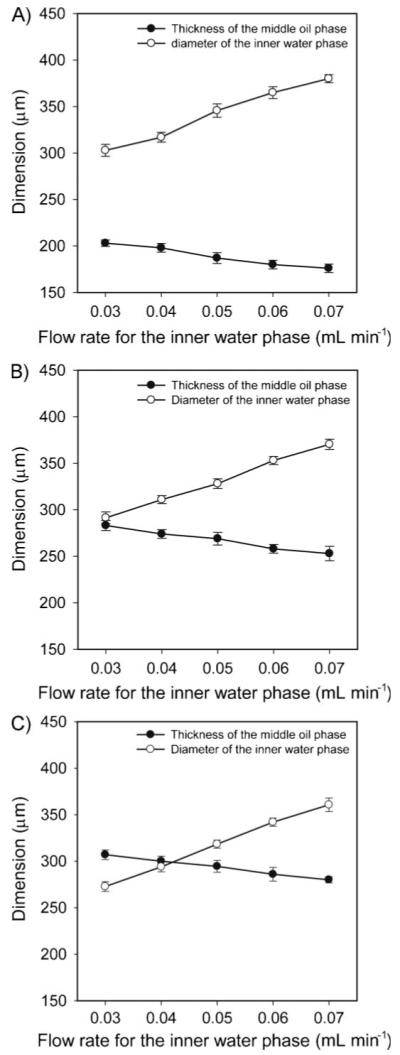
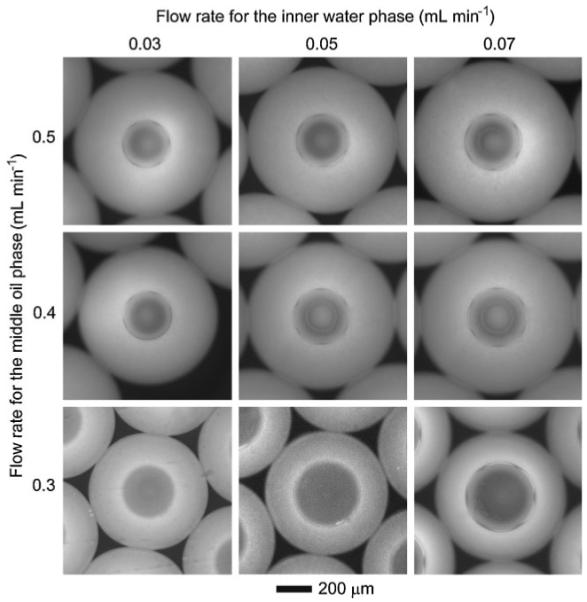
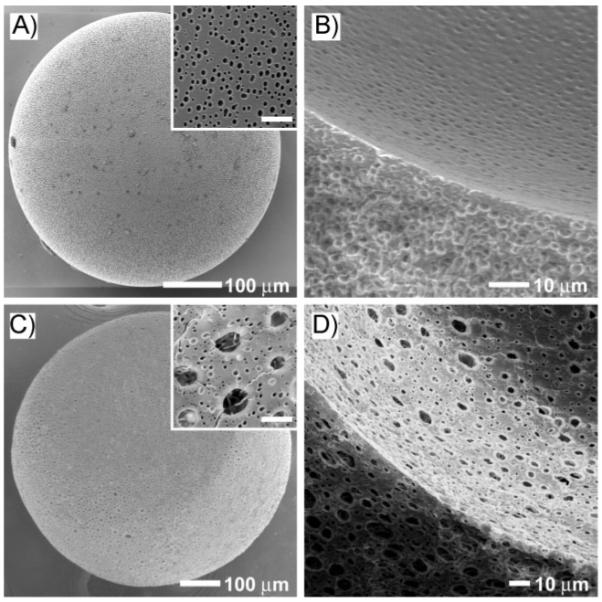
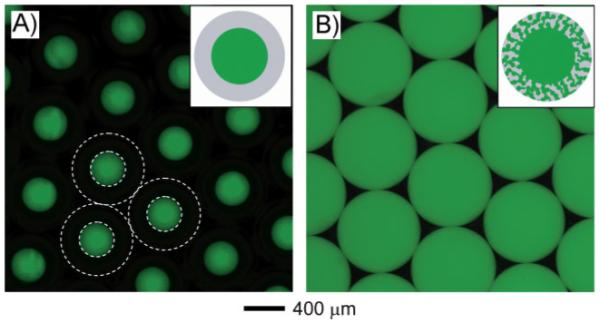
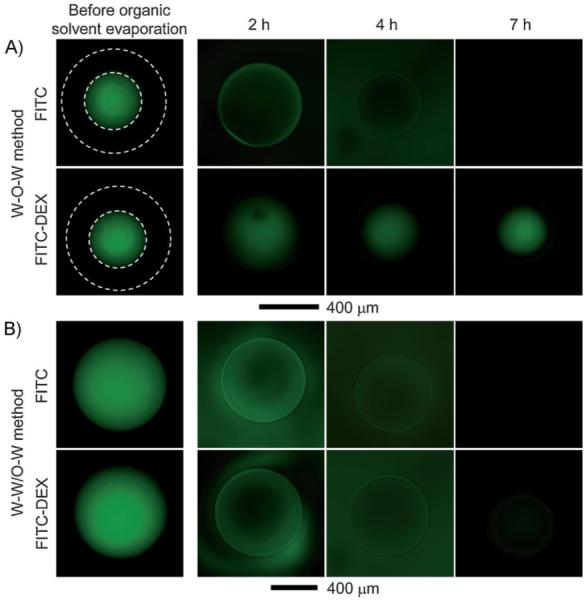
Poly(d,l-lactide-co-glycolide) (PLGA) microbeads with a hollow interior and porous wall are prepared using a simple fluidic device fabricated with PVC tubes, glass capillaries, and a needle. Using the fluidic device with three flow channels, uniform water-in-oil-in-water (W-O-W) emulsions with a single inner water droplet can be achieved with controllable dimensions by varying the flow rate of each phase. The resultant W-O-W emulsions evolve into PLGA microbeads with a hollow interior and porous wall after the organic solvent in the middle oil phase evaporates. Two approaches are employed for developing a porous structure in the wall: emulsion templating and fast solvent evaporation. For emulsion templating, a homogenized, water-in-oil (W/O) emulsion is introduced as the middle phase instead of the pure oil phase. Low-molecular-weight fluorescein isothiocyanate (FITC) and high-molecular-weight fluorescein isothiocyanate-dextran conjugate (FITC-DEX) is added to the inner water phase to elucidate both the pore size and their interconnectivity in the wall of the microbeads. From optical fluorescence microscopy and scanning electron microscopy images, it is confirmed that the emulsion-templated microbeads (W-W/O-W) have larger and better interconnected pores than the W-O-W microbeads. These microstructured microbeads can potentially be employed for cell encapsulation and tissue engineering, as well as protection of active agents.


Figures

Figure 1
Figure 1
Schematic diagrams of the fluidic device for producing the A) W-O-W emulsions and B) W-W/O-W emulsions, respectively. In both cases, an aqueous PVA solution (2 wt%) was used as the inner water phase and outer continuous phase. A solution of PLGA (5 wt%) in DCM served as the middle oil phase in the W-O-W emulsion, whereas a homogenized W/O (2 wt% PVA/5 wt% PLGA, weight ratio 4:6) emulsion was used as the middle oil phase in the W-W/O-W method.
Figure 2
Figure 2
Fluorescence microscopy image of uniform W-O-W emulsions fabricated using the fluidic device. The emulsions with an aqueous interior (dark red) surrounded by the PLGA solution (red) in DCM were dispersed in the continuous water phase (black). In this case, rhodamine 6G (a hydrophobic dye) was added to the oil phase as a fluorescence probe. The flow rates for the inner water phase, middle oil phase, and outer water phase were 0.03, 0.3, and 2 mL min-1, respectively. The arrow indicates the middle oil phase and the white dotted lines indicate the boundaries between the phases. The inset depicts O-W emulsion for comparison to W-O-W emulsion. The scale bars are 200 μm.
Figure 3
Figure 3
Effects of the flow rate of each phase on the average diameter (d) of the inner water droplet and thickness (t) of the middle oil phase in the W-O-W system. The flow rates for the middle oil phase were A) 0.3, B) 0.4, and C) 0.5 mL min-1. The flow rate for the outer water phase was kept at 2 mL min-1.
Figure 4
Figure 4
Fluorescence microscopy images (grayscale) of the W-O-W emulsions obtained at different flow rates for the inner water phase and the middle oil phase. The flow rate of the outer water phase was kept at 2 mL min-1.
Figure 5
Figure 5
SEM images of PLGA microbeads with hollow interiors and porous walls prepared by the A,B) W-O-W method and C,D) W-W/O-W method, respectively. The outer surfaces of the microbeads are shown in (A) and (C), while the cross sections and the inner surfaces are shown in (B) and (D). The flow rates of the inner water, middle oil, and outer water phase were 0.03, 0.3, 2 mL min-1, respectively, for the W-O-W method, and 0.035, 0.3, and 2.5 mL min-1, respectively, for the W-W/O-W method. The insets in (A) and (C) are high magnifications of the outer surfaces of the microbeads, where the scale bars are 5 μm.
Figure 6
Figure 6
Fluorescence microscopy images of close-packed A) W-O-W emulsions and B) W-W/O-W emulsions before evaporation of the organic solvent. FITC-dextran (Mw ≈ 20 000) was included into the inner water phase as a probe dye. The white dotted lines indicate the boundaries between the phases.
Figure 7
Figure 7
Fluorescence microscopy images of PLGA microbeads fabricated using the A) W-O-W and B) W-W/O-W method, respectively, as a function of time. After the resultant emulsions were collected with a glass Petri dish, images were taken at 2, 4, and 7 h while the solvent was removed by evaporation. FITC (Mw ≈ 389) and FITC-dextran (Mw ≈ 20 000) were used as probes by adding them into the inner water phase to evaluate the size and interconnectivity of the pores. The white dotted lines indicate the outer surface of the microbeads.

Similar articles

Cited by

References

    1. Lee M-H, Oh S-G, Moon S-K, Bae S-Y. J. Colloid Interface Sci. 2001;240:83. - PubMed
    1. Ferreira LAM, Seiller M, Grossiord JL, Marty JP, Wepierre J. Int. J. Pharm. 1994;109:251.
    1. Nakano M. Adv. Drug Delivery Rev. 2000;45:1. - PubMed
    1. Vasiljevic D, Parojcic J, Primorac M, Vuleta G. Int. J. Pharm. 2006;309:171. - PubMed
    1. Köster S, Angilè FE, Duan H, Agresti JJ, Wintner A, Schmitz C, Rowat AC, Merten CA, Pisignano D, Griffiths AD, Weitz DA. Lab Chip. 2008;8:1110. - PubMed

LinkOut - more resources