

Elucidation of the structure of the membrane anchor of penicillin-binding protein 5 of Escherichia coli
- PMID: 20192190
- PMCID: PMC2862349
- DOI: 10.1021/ja9094445
Elucidation of the structure of the membrane anchor of penicillin-binding protein 5 of Escherichia coli
Abstract
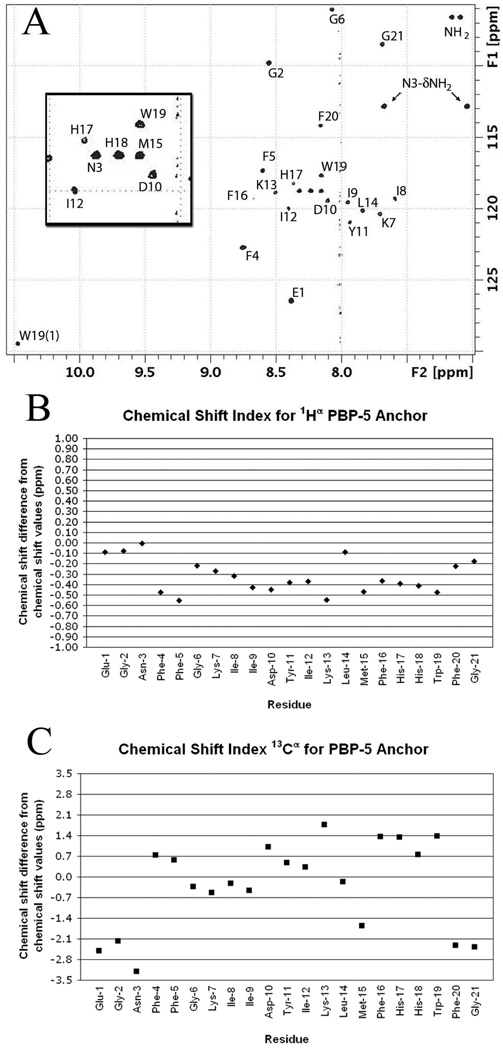
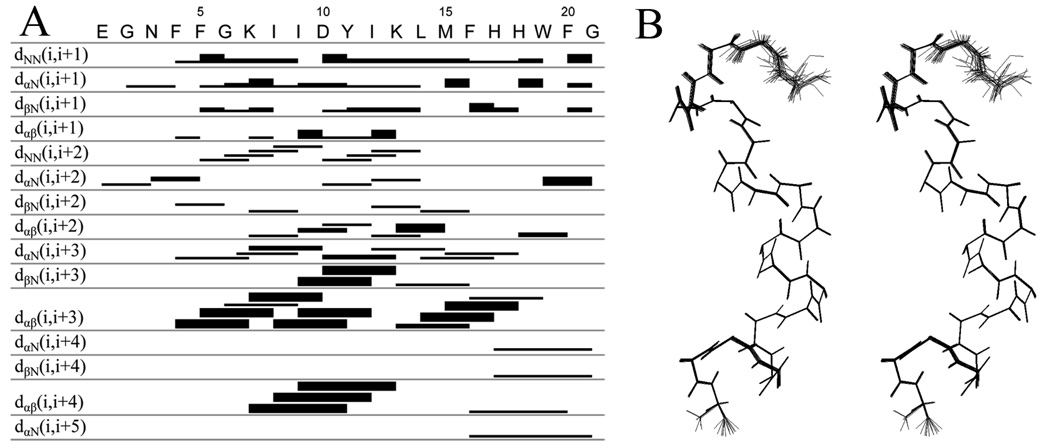
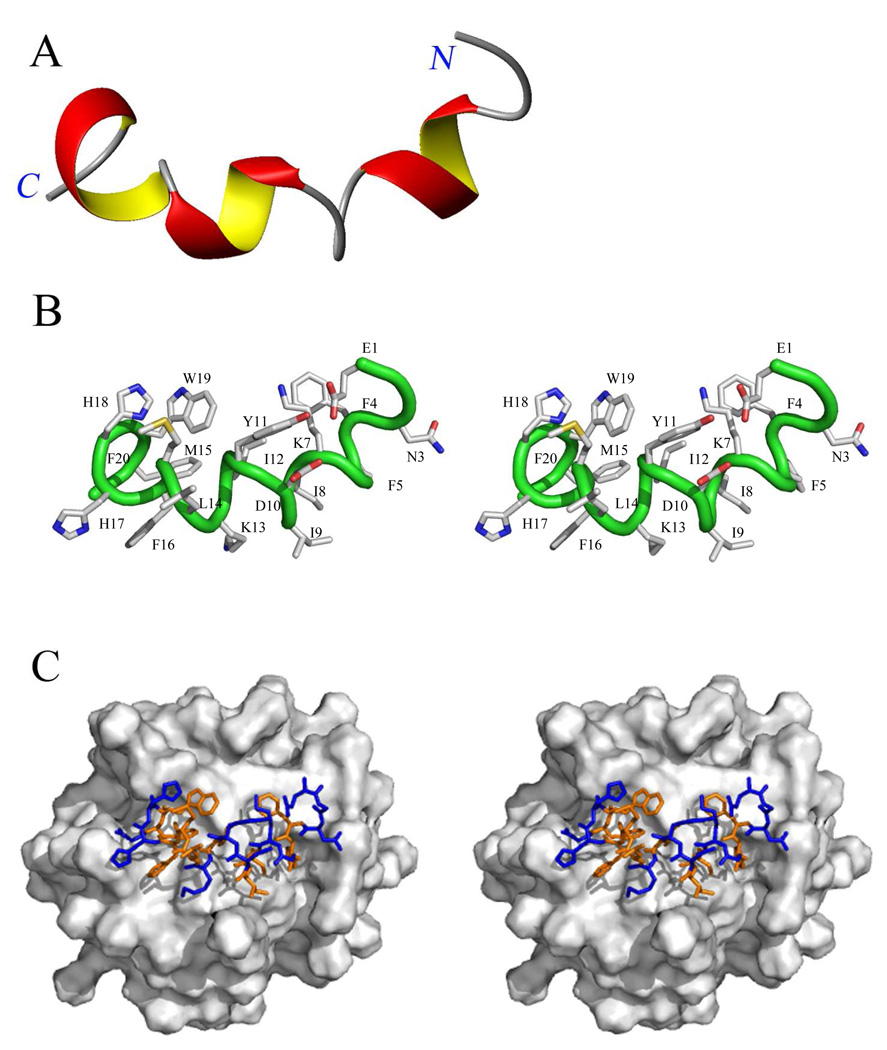
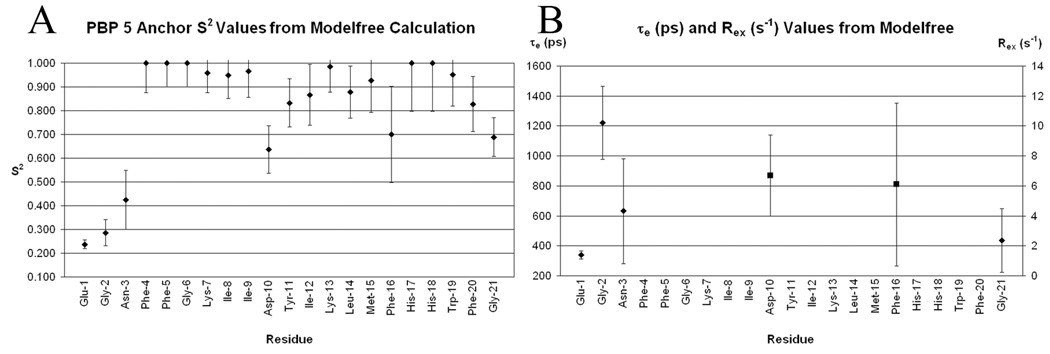
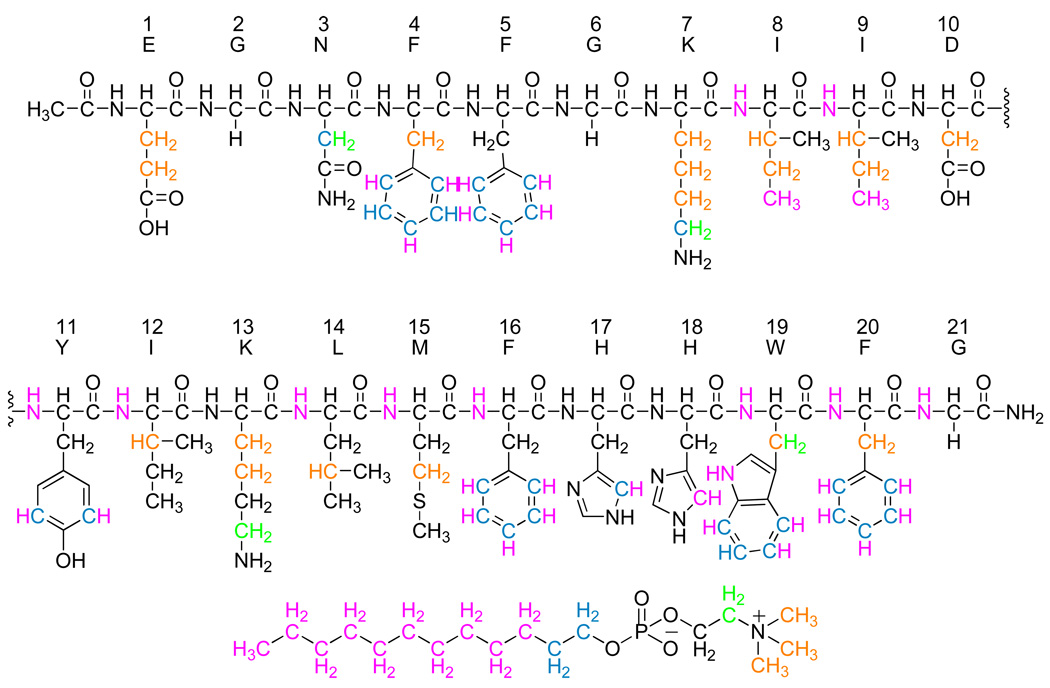
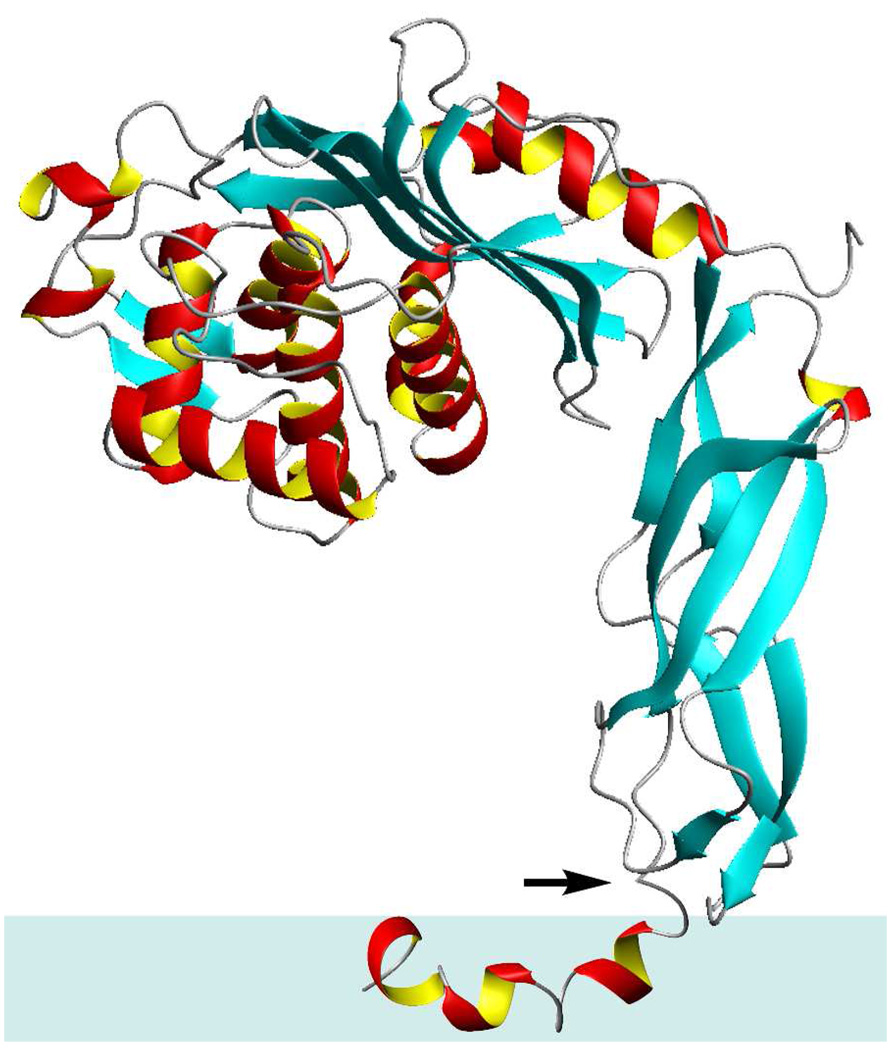
Penicillin-binding protein 5 (PBP 5) of Escherichia coli is a membrane-bound cell wall dd-carboxypeptidase, localized in the outer leaflet of the cytosolic membrane of this Gram-negative bacterium. Not only is it the most abundant PBP of E. coli, but it is as well a target for penicillins and is the most studied of the PBP enzymes. PBP 5, as a representative peripheral membrane protein, is anchored to the cytoplasmic membrane by the 21 amino acids of its C-terminus. Although the importance of this terminus as a membrane anchor is well recognized, the structure of this anchor was previously unknown. Using natural isotope abundance NMR, the structure of the PBP 5 anchor peptide within a micelle was determined. The structure conforms to a helix-bend-helix-turn-helix motif and reveals that the anchor enters the membrane so as to form an amphiphilic structure within the interface of the hydrophilic/hydrophobic boundary regions near the lipid head groups. The bend and the turn within the motif allow the C-terminus to exit from the same side of the membrane that is penetrated. The PBP anchor sequences represent extraordinary diversity, encompassing both N-terminal and C-terminal anchoring domains. This study establishes a surface adherence mechanism for the PBP 5 C-terminus anchor peptide, as the structural basis for further study toward understanding the role of these domains in selecting membrane environments and in the assembly of the multienzyme hyperstructures of bacterial cell wall biosynthesis.
Figures
Similar articles
-
Analysis of the membrane-anchoring properties of the putative amphiphilic alpha-helical anchor at the C-terminus of Escherichia coli PBP 6.Microbiology (Reading). 1994 Jan;140 ( Pt 1):73-7. doi: 10.1099/13500872-140-1-73. Microbiology (Reading). 1994. PMID: 8162192
-
Contribution of membrane-binding and enzymatic domains of penicillin binding protein 5 to maintenance of uniform cellular morphology of Escherichia coli.J Bacteriol. 2002 Jul;184(13):3630-9. doi: 10.1128/JB.184.13.3630-3639.2002. J Bacteriol. 2002. PMID: 12057958 Free PMC article.
-
Penicillin-binding protein 1B from Escherichia coli contains a membrane association site in addition to its transmembrane anchor.J Biol Chem. 1993 Mar 15;268(8):5632-41. J Biol Chem. 1993. PMID: 8449926
-
Multimodular penicillin-binding proteins: an enigmatic family of orthologs and paralogs.Microbiol Mol Biol Rev. 1998 Dec;62(4):1079-93. doi: 10.1128/MMBR.62.4.1079-1093.1998. Microbiol Mol Biol Rev. 1998. PMID: 9841666 Free PMC article. Review.
-
Physiological functions of D-alanine carboxypeptidases in Escherichia coli.Trends Microbiol. 2008 Jul;16(7):309-17. doi: 10.1016/j.tim.2008.04.006. Epub 2008 Jun 5. Trends Microbiol. 2008. PMID: 18539032 Review.
Cited by
-
Coordinated and Distinct Roles of Peptidoglycan Carboxypeptidases DacC and DacA in Cell Growth and Shape Maintenance under Stress Conditions.Microbiol Spectr. 2023 Jun 15;11(3):e0001423. doi: 10.1128/spectrum.00014-23. Epub 2023 Apr 26. Microbiol Spectr. 2023. PMID: 37098975 Free PMC article.
-
Penicillin-binding protein 5 can form a homo-oligomeric complex in the inner membrane of Escherichia coli.Protein Sci. 2011 Sep;20(9):1520-9. doi: 10.1002/pro.677. Epub 2011 Jul 13. Protein Sci. 2011. PMID: 21674665 Free PMC article.
-
Analysis of some common pathogens and their drug resistance to antibiotics.Pak J Med Sci. 2013 Jan;29(1):135-9. doi: 10.12669/pjms.291.2744. Pak J Med Sci. 2013. PMID: 24353525 Free PMC article.
-
Septal and lateral wall localization of PBP5, the major D,D-carboxypeptidase of Escherichia coli, requires substrate recognition and membrane attachment.Mol Microbiol. 2010 Jul;77(2):300-23. doi: 10.1111/j.1365-2958.2010.07205.x. Epub 2010 Jun 7. Mol Microbiol. 2010. PMID: 20545860 Free PMC article.
-
Cell-Wall Recycling of the Gram-Negative Bacteria and the Nexus to Antibiotic Resistance.Chem Rev. 2018 Jun 27;118(12):5952-5984. doi: 10.1021/acs.chemrev.8b00277. Epub 2018 May 30. Chem Rev. 2018. PMID: 29847102 Free PMC article. Review.
References
-
- Weiner JH, Li L. Biochim. Biophys. Acta. 2008;1778:1698–1713. - PubMed
-
- Bernsel A, Daley DO. Trends Microbiol. 2009;17:444–449. - PubMed
-
- Norris V, den Blaauwen T, Doi RH, Harshey RM, Janniere L, Jiménez-Sánchez A, Jin DJ, Levin PA, Mileykovskaya E, Minsky A, Misevic G, Ripoll CMS, Jr, Skarstad K, Thellier M. Annu. Rev.Microbiol. 2007;61:309–329. - PubMed
-
- den Blaauwen T, de Pedro MA, Nguyen-Distèche M, Ayala JA. FEMS Microbiol Rev. 2008;32:321–344. - PubMed
Publication types
MeSH terms
Substances
Grants and funding
LinkOut - more resources
Full Text Sources
Molecular Biology Databases
Research Materials
Miscellaneous
