

Comparison of once-daily versus twice-daily combination antiretroviral therapy in treatment-naive patients: results of AIDS clinical trials group (ACTG) A5073, a 48-week randomized controlled trial
- PMID: 20192725
- PMCID: PMC2833234
- DOI: 10.1086/651118
Comparison of once-daily versus twice-daily combination antiretroviral therapy in treatment-naive patients: results of AIDS clinical trials group (ACTG) A5073, a 48-week randomized controlled trial
Abstract
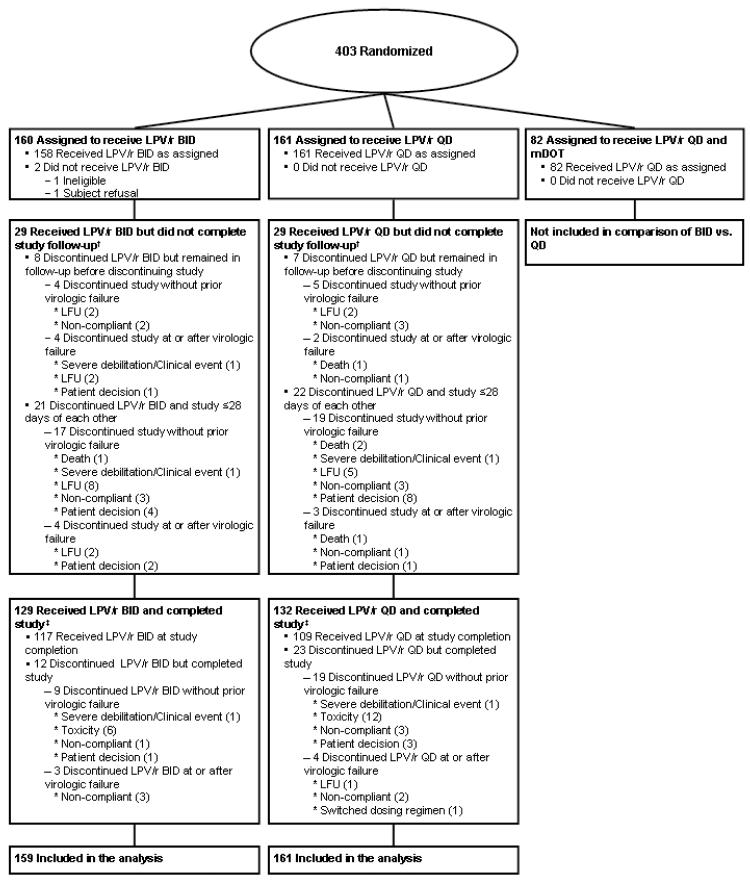
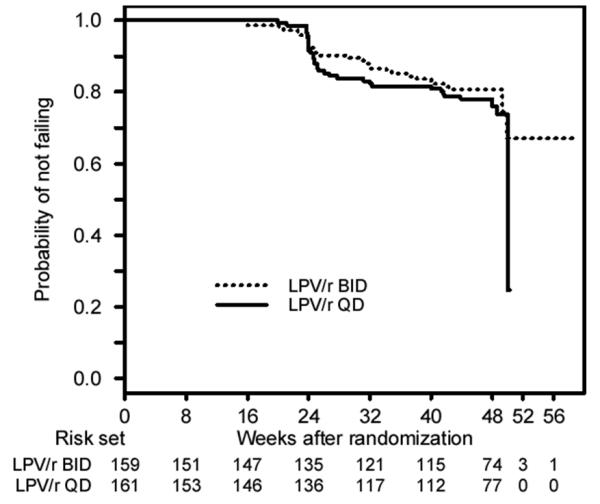
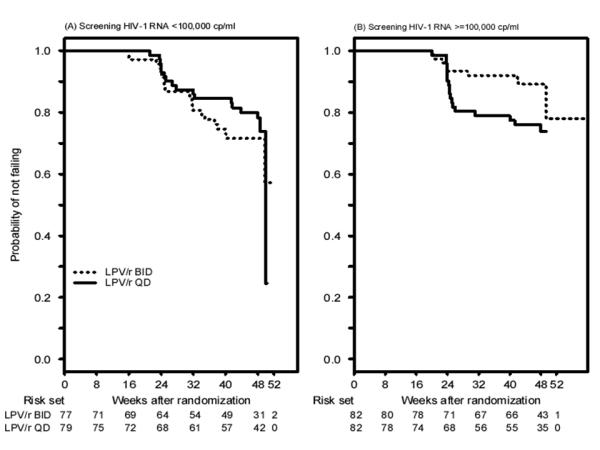
Background: Dosing frequency is an important determinant of regimen effectiveness. Methods. To compare efficacy of once-daily (QD) versus twice-daily (BID) antiretroviral therapy, we randomized human immunodeficiency virus (HIV)-positive, treatment-naive patients to lopinavir-ritonavir (LPV/r) administered at a dosage of 400 mg of lopinavir and 100 mg of ritonavir BID (n = 160) or 800 mg of lopinavir and 200 mg of ritonavir QD (n = 161), plus either emtricitabine 200 mg QD and extended-release stavudine at a dosage of 100 mg QD or tenofovir at a dosage of 300 mg QD. Randomization was stratified by screening HIV RNA level <100,000 copies/mL versus > or = 100,000 copies/mL. The primary efficacy end point was sustained virologic response (SVR; defined as reaching and maintaining an HIV RNA level <200 copies/mL) through week 48.
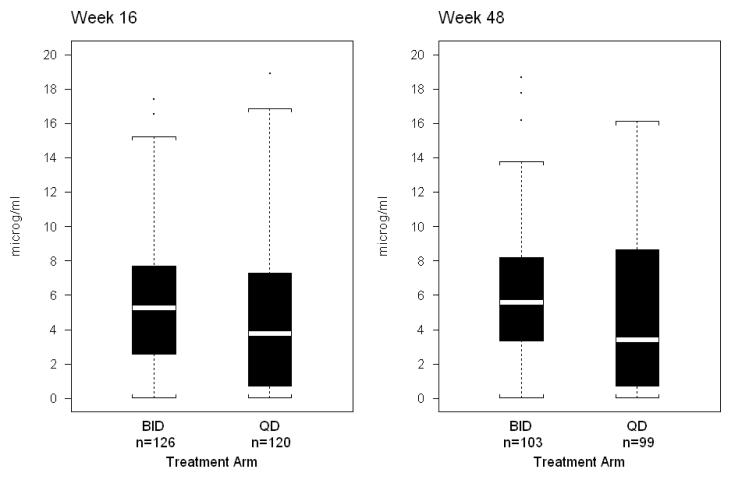
Results: Subjects were 78% male, 33% Hispanic, and 34% black. A total of 82% of subjects completed the study, and 71% continued to receive the initially assigned dosage schedule. The probability of SVR did not differ significantly for the BID versus QD comparison, with an absolute proportional difference of 0.03 (95% confidence interval [CI], -0.07 to 0.12). The comparison depended on the screening RNA stratum (P=.038); in the higher RNA stratum, the probability of SVR was significantly better in the BID arm than in the QD arm: 0.89 (95% CI, 0.79-0.94) versus 0.76 (95% CI, 0.64-0.84), a difference of 0.13 (95% CI, 0.01-0.25). Lopinavir trough plasma concentrations were higher with BID dosing. Adherence to prescribed doses of LPV/r was 90.6% in the QD arm versus 79.9% in the BID arm (P<.001). Conclusions. Although subjects assigned to QD regimens had better adherence, overall treatment outcomes were similar in the QD and BID arms. Subjects with HIV RNA levels > or =100,000 copies/mL had better SVR with BID regimens at 48 weeks, which suggests a possible advantage in this setting for more frequent dosing. Clinical trial registration. ClinicalTrials.gov registration number: NCT00036452.
Figures
Similar articles
-
Short communication: Comparable safety and efficacy with once-daily versus twice-daily dosing of lopinavir/ritonavir tablets with emtricitabine + tenofovir DF in antiretroviral-naïve, HIV type 1-infected subjects: 96 week final results of the randomized trial M05-730.AIDS Res Hum Retroviruses. 2010 Aug;26(8):841-5. doi: 10.1089/aid.2009.0307. AIDS Res Hum Retroviruses. 2010. PMID: 20672994 Clinical Trial.
-
A lopinavir/ritonavir-based once-daily regimen results in better compliance and is non-inferior to a twice-daily regimen through 96 weeks.AIDS Res Hum Retroviruses. 2007 Dec;23(12):1505-14. doi: 10.1089/aid.2007.0107. AIDS Res Hum Retroviruses. 2007. PMID: 18160008 Clinical Trial.
-
Efficacy and safety of once-daily darunavir/ritonavir versus lopinavir/ritonavir in treatment-naive HIV-1-infected patients at week 48.AIDS. 2008 Jul 31;22(12):1389-97. doi: 10.1097/QAD.0b013e32830285fb. AIDS. 2008. PMID: 18614861 Clinical Trial.
-
Lopinavir/ritonavir: a review of its use in the management of HIV infection.Drugs. 2003;63(8):769-802. doi: 10.2165/00003495-200363080-00004. Drugs. 2003. PMID: 12662125 Review.
-
Darunavir: a review of its use in the management of HIV infection in adults.Drugs. 2009;69(4):477-503. doi: 10.2165/00003495-200969040-00007. Drugs. 2009. PMID: 19323590 Review.
Cited by
-
Lower pill burden and once-daily antiretroviral treatment regimens for HIV infection: A meta-analysis of randomized controlled trials.Clin Infect Dis. 2014 May;58(9):1297-307. doi: 10.1093/cid/ciu046. Epub 2014 Jan 22. Clin Infect Dis. 2014. PMID: 24457345 Free PMC article.
-
Retention in care and medication adherence: current challenges to antiretroviral therapy success.Drugs. 2015 Apr;75(5):445-54. doi: 10.1007/s40265-015-0373-2. Drugs. 2015. PMID: 25792300 Free PMC article.
-
Barriers to antiretroviral therapy adherence and plasma HIV RNA suppression among AIDS clinical trials group study participants.AIDS Patient Care STDS. 2015 Mar;29(3):111-6. doi: 10.1089/apc.2014.0255. Epub 2015 Jan 23. AIDS Patient Care STDS. 2015. PMID: 25615029 Free PMC article.
-
Population pharmacokinetic modelling to quantify the magnitude of drug-drug interactions between amlodipine and antiretroviral drugs.Eur J Clin Pharmacol. 2021 Jul;77(7):979-987. doi: 10.1007/s00228-020-03060-2. Epub 2021 Jan 16. Eur J Clin Pharmacol. 2021. PMID: 33452585 Free PMC article.
-
Racial differences in response to antiretroviral therapy for HIV infection: an AIDS clinical trials group (ACTG) study analysis.Clin Infect Dis. 2013 Dec;57(11):1607-17. doi: 10.1093/cid/cit595. Epub 2013 Sep 17. Clin Infect Dis. 2013. PMID: 24046302 Free PMC article. Clinical Trial.
References
-
- Claxton AJ, Cramer J, Pierce C. A systematic review of the associations between dose regimens and medication compliance. Clin Ther. 2001;23:1296–1310. - PubMed
-
- Moyle G. Overcoming obstacles to the success of protease inhibitors in highly active antiretroviral therapy regimens. AIDS Patient Care STDS. 2002;16:585–97. - PubMed
-
- Maitland D, Jackson A, Osorio J, Mandalia S, Gazzard BG, Moyle GJ, Epivir-Ziagen (EZ) Switch Study Team Switching from twice-daily abacavir and lamivudine to the once-daily fixed-dose combination tablet of abacavir and lamivudine improves patient adherence and satisfaction with therapy. HIV Med. 2008;9:667–72. - PubMed
-
- Cramer JA, Mattson RH, Prevey ML, Scheyer RD, Ouellette VL. How often is medication taken as prescribed? A novel assessment technique. JAMA. 1989;261:3273–7. - PubMed
-
- Hughes D. Less is more: medicines that require less frequent administration improve adherence, but are they better? Pharmacoeconomics. 2006;24:211–213. - PubMed
Publication types
MeSH terms
Substances
Associated data
Grants and funding
- UL1 RR025005/RR/NCRR NIH HHS/United States
- U01 AI069439/AI/NIAID NIH HHS/United States
- U01 AI069450/AI/NIAID NIH HHS/United States
- UM1 AI069474/AI/NIAID NIH HHS/United States
- AA54907/AA/NIAAA NIH HHS/United States
- U01 AI046381/AI/NIAID NIH HHS/United States
- U01 AI069511/AI/NIAID NIH HHS/United States
- U01 AI069477/AI/NIAID NIH HHS/United States
- AI068634/AI/NIAID NIH HHS/United States
- U01 AI069494/AI/NIAID NIH HHS/United States
- U01 AI069513/AI/NIAID NIH HHS/United States
- UM1 AI069423/AI/NIAID NIH HHS/United States
- UM1 AI069472/AI/NIAID NIH HHS/United States
- U01 AI069474/AI/NIAID NIH HHS/United States
- U01 AI069434/AI/NIAID NIH HHS/United States
- U01 AI069423/AI/NIAID NIH HHS/United States
- UM1 AI069513/AI/NIAID NIH HHS/United States
- M01 RR000096/RR/NCRR NIH HHS/United States
- M01 RR000046/RR/NCRR NIH HHS/United States
- U01 AI069465/AI/NIAID NIH HHS/United States
- UM1 AI069434/AI/NIAID NIH HHS/United States
- U01 AI069463/AI/NIAID NIH HHS/United States
- UM1 AI069432/AI/NIAID NIH HHS/United States
- U01 AI069428/AI/NIAID NIH HHS/United States
- U01 AI069532/AI/NIAID NIH HHS/United States
- UM1 AI069439/AI/NIAID NIH HHS/United States
- P30 AI045008/AI/NIAID NIH HHS/United States
- M01 RR000044/RR/NCRR NIH HHS/United States
- UM1 AI068634/AI/NIAID NIH HHS/United States
- U01 AI069501/AI/NIAID NIH HHS/United States
- U01 AI68636/AI/NIAID NIH HHS/United States
- U01 AI069432/AI/NIAID NIH HHS/United States
- U01 AI046370/AI/NIAID NIH HHS/United States
- U01 AI068636/AI/NIAID NIH HHS/United States
- UM1 AI069463/AI/NIAID NIH HHS/United States
- M01 RR000051/RR/NCRR NIH HHS/United States
- U01 AI025859/AI/NIAID NIH HHS/United States
- UM1 AI069450/AI/NIAID NIH HHS/United States
- UM1 AI069532/AI/NIAID NIH HHS/United States
- UM1 AI069465/AI/NIAID NIH HHS/United States
- U01 AI032783/AI/NIAID NIH HHS/United States
- U01 AI069472/AI/NIAID NIH HHS/United States
- U01 AI068634/AI/NIAID NIH HHS/United States
- P30 AI050410/AI/NIAID NIH HHS/United States
