

Computational morphodynamics: a modeling framework to understand plant growth
- PMID: 20192756
- PMCID: PMC4120954
- DOI: 10.1146/annurev-arplant-042809-112213
Computational morphodynamics: a modeling framework to understand plant growth
Abstract
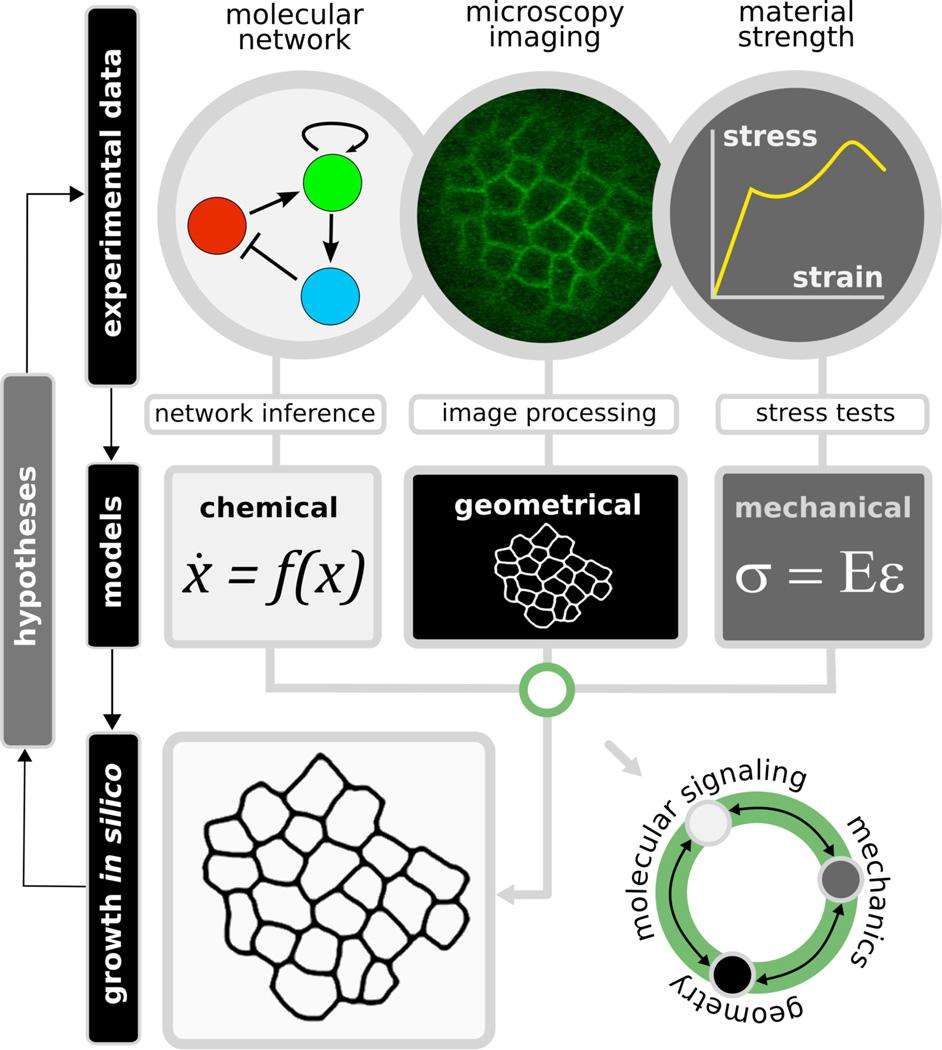
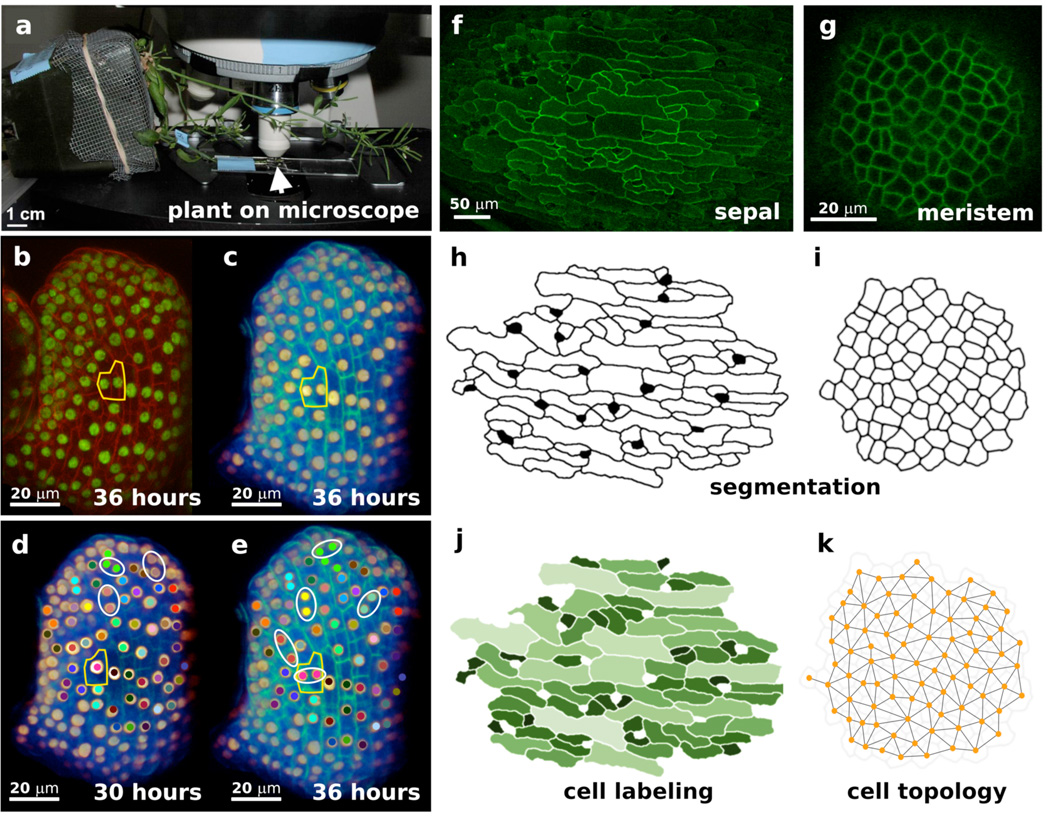
Computational morphodynamics utilizes computer modeling to understand the development of living organisms over space and time. Results from biological experiments are used to construct accurate and predictive models of growth. These models are then used to make novel predictions that provide further insight into the processes involved, which can be tested experimentally to either confirm or rule out the validity of the computational models. This review highlights two fundamental challenges: (a) to understand the feedback between mechanics of growth and chemical or molecular signaling, and (b) to design models that span and integrate single cell behavior with tissue development. We review different approaches to model plant growth and discuss a variety of model types that can be implemented to demonstrate how the interplay between computational modeling and experimentation can be used to explore the morphodynamics of plant development.
Figures
Similar articles
-
Computational modeling of plant root development: the art and the science.New Phytol. 2025 Jun;246(6):2446-2461. doi: 10.1111/nph.70164. Epub 2025 Apr 23. New Phytol. 2025. PMID: 40269551 Free PMC article. Review.
-
Computational models of plant development and form.New Phytol. 2012 Feb;193(3):549-569. doi: 10.1111/j.1469-8137.2011.04009.x. New Phytol. 2012. PMID: 22235985 Review.
-
Plant hormone signaling during development: insights from computational models.Curr Opin Plant Biol. 2013 Feb;16(1):19-24. doi: 10.1016/j.pbi.2012.11.006. Epub 2012 Dec 6. Curr Opin Plant Biol. 2013. PMID: 23219863 Review.
-
On evaluating models in Computational Morphodynamics.Curr Opin Plant Biol. 2012 Feb;15(1):103-10. doi: 10.1016/j.pbi.2011.09.007. Epub 2011 Oct 13. Curr Opin Plant Biol. 2012. PMID: 22000039
-
Formal description of plant morphogenesis.J Exp Bot. 2019 Jul 23;70(14):3601-3613. doi: 10.1093/jxb/erz210. J Exp Bot. 2019. PMID: 31290543 Review.
Cited by
-
Growth dynamics of the Arabidopsis fruit is mediated by cell expansion.Proc Natl Acad Sci U S A. 2019 Dec 10;116(50):25333-25342. doi: 10.1073/pnas.1914096116. Epub 2019 Nov 22. Proc Natl Acad Sci U S A. 2019. PMID: 31757847 Free PMC article.
-
Overcoming the Challenges to Enhancing Experimental Plant Biology With Computational Modeling.Front Plant Sci. 2021 Jul 20;12:687652. doi: 10.3389/fpls.2021.687652. eCollection 2021. Front Plant Sci. 2021. PMID: 34354723 Free PMC article. Review.
-
Root phenotypes for improved nitrogen capture.Plant Soil. 2024;502(1-2):31-85. doi: 10.1007/s11104-023-06301-2. Epub 2023 Oct 4. Plant Soil. 2024. PMID: 39323575 Free PMC article. Review.
-
An optimized live imaging and growth analysis approach for Arabidopsis Sepals.bioRxiv [Preprint]. 2024 Jan 24:2024.01.22.576735. doi: 10.1101/2024.01.22.576735. bioRxiv. 2024. Update in: Front Plant Sci. 2024 Sep 03;15:1449195. doi: 10.3389/fpls.2024.1449195. PMID: 38328103 Free PMC article. Updated. Preprint.
-
Variability in the control of cell division underlies sepal epidermal patterning in Arabidopsis thaliana.PLoS Biol. 2010 May 11;8(5):e1000367. doi: 10.1371/journal.pbio.1000367. PLoS Biol. 2010. PMID: 20485493 Free PMC article.
References
-
- Alvarez-Buylla ER, Benitez M, Davila EB, Chaos A, Espinosa-Soto C, Padilla-Longoria P. Gene regulatory network models for plant development. Curr Opin Plant Biol. 2007;10:83–91. - PubMed
-
- Baskin TI. Anisotropic expansion of the plant cell wall. Annual Review of Cell and Developmental Biology. 2005;21:203–222. - PubMed
-
- Becker EB, Carey GF, Oden JT. Finite elements. v. Englewood Cliffs, N.J.: Prentice-Hall.; 1981. pp. 1–6.
-
- Beltman JB, Maree AF, de Boer RJ. Spatial modelling of brief and long interactions between T cells and dendritic cells. Immunol Cell Biol. 2007;85:306–314. - PubMed
Publication types
MeSH terms
Grants and funding
LinkOut - more resources
Full Text Sources
