Review
. 2010:28:535-71.
doi: 10.1146/annurev-immunol-030409-101221.

A genomic approach to human autoimmune diseases

Affiliations
Review

A genomic approach to human autoimmune diseases

Virginia Pascual et al. Annu Rev Immunol. 2010.

Abstract

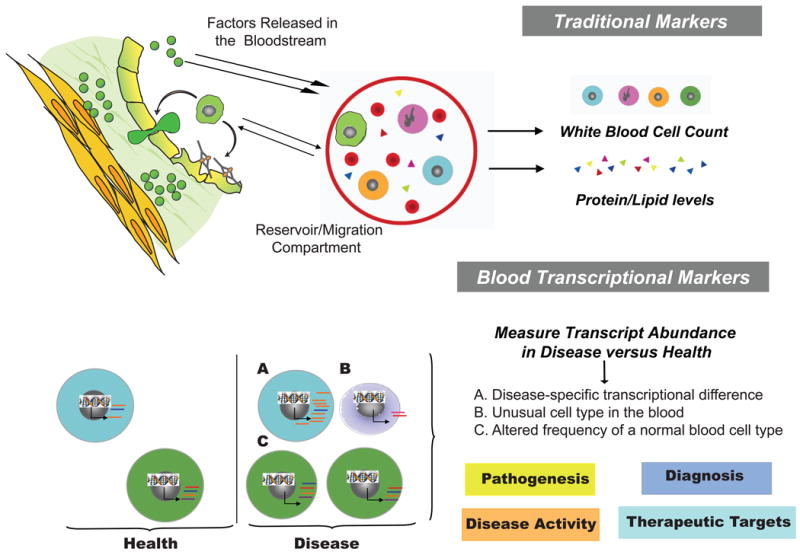
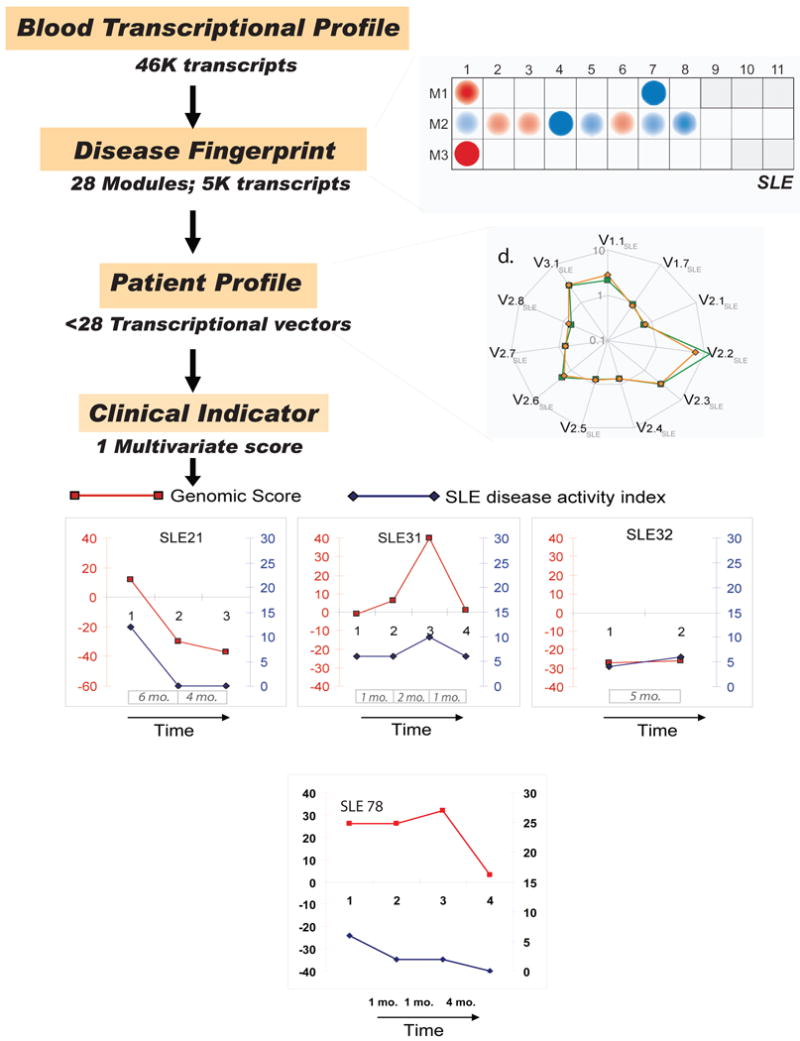
The past decade has seen an explosion in the use of DNA-based microarrays. These techniques permit assessment of RNA abundance on a genome-wide scale. Medical applications emerged in the field of cancer, with studies of both solid tumors and hematological malignancies leading to the development of tests that are now used to personalize therapeutic options. Microarrays have also been used to analyze the blood transcriptome in a wide range of diseases. In human autoimmune diseases, these studies are showing potential for identifying therapeutic targets as well as biomarkers for diagnosis, assessment of disease activity, and response to treatment. More quantitative and sensitive high-throughput RNA profiling methods are starting to be available and will be necessary for transcriptome analyses to become routine tests in the clinical setting. We expect this to crystallize within the coming decade, as these methods become part of the personalized medicine armamentarium.


Figures

Figure 1
Figure 1
The blood can be used as a source of transcriptional biomarkers to understand the pathogenesis, diagnose, assess severity and find therapeutic targets for human autoimmune diseases.
Figure 2
Figure 2. SLE signature
Hierarchical clustering of gene expression from blood leukocytes of 9 healthy children, 30 with SLE and 12 with juvenile chronic arthritis. SLE patients were ranked according to their SLEDAI at the time of blood draw. Each row represents a separate gene and each column a separate patient. 374 transcript sequences were selected as being differentially expressed in SLE compared to healthy patients. The normalized expression index for each transcript sequence (rows) in each sample (columns) is indicated by a color code. Red, yellow and blue squares indicate that expression of the gene is greater than, equal to or less than the mean level of expression across 9 healthy controls. The scale extends from fluorescence ratios of 0.25 to 4.0. (Original figure published in J. Exp. Med. 2003 Mar 17;197(6):711-23)
Figure 3
Figure 3. High dose steroid intravenous pulse extinguishes the type I IFN signature in SLE blood
Analysis of PBMCs from 3 pediatric SLE patients before and after treatment with high dose i.v. Methylprednisolone (1g/day for 3 days). All patients show down-regulation of IFN-regulated transcripts (upper panel) while expression of non-type I IFN-inducible transcripts (lower panel) does not change significantly. Patient #5 did not display granulopoiesis signature before high dose GC therapy. Original figure published in J. Exp. Med. 2003 Mar 17;197(6):711-23
Figure 4
Figure 4. A unified view of SLE pathogenesis
Left: HLA and non-HLA gene polymorphisms contribute to SLE susceptibility. Among them, TLR/IFN signaling pathway-related genes have recently been described. Right: Both environmental triggers (i.e. viral infections) and chromatin-containing immune complexes might contribute to the unabated production of type I IFN by pDCs in SLE patients. Increased bioavailability of type I IFN induces and maintains the generation of mature DCs, tilting the fate of autoreactive T lymphocytes which have escaped central tolerance from deletion to activation. These mature DCs activate cytotoxic CD8+ T cells to generate nucleosomes which can be captured and presented by IFN-DCs. Together with IL-6, type I IFN promotes the differentiation of mature B cells into plasma cells, which secrete autoantibodies. A direct effect of IFN-alpha on endothelial cells could also contribute to premature atherosclerosis in SLE patients.
Figure 5
Figure 5. A non-type I IFN induced signature in SLE PBMCs (Granulopoiesis signature)
a) Genes are divided into three categories: enzymes and their inhibitors, bactericidal proteins and others. Median expression and the number of patients who display more than 2-fold increase (red) in gene expression. ** Significant after Bonferroni correction, * significant after Benjamini and Hochberg correction. b) presence of granular cells in leukocytes that display granulopoiesis – related RNA. Flow cytometry analysis (forward scatter vs. side scatter) of Ficoll-separated mononuclear cells. The gated cells are immature neutrophils. c) Correlation between the defensin alpha (DEF3) levels and the numbers of cells gated as shown in b.
Figure 6
Figure 6. Gene expression profiling led to the identification of IL-1 b in the pathogenesis of SoJIA
(A) Incubation of healthy PBMCs with autologous sera (AS) or sera from four patients with active SoJIA. (B) Transcriptional changes induced by SoJIA sera included the up-regulation of IL1b and its receptors. (C) Treatment with daily injections of anakinra induced the resolution of systemic symptoms (fever) and arthritis in 9/9 and 7/9 patients respectively (adapted from Curr Opin Immunol. 2007 Dec;19(6):623-32).
Figure 7
Figure 7. Analysis of significance across diseases identifies 88 SoJIA-specific transcripts
(A) Eight healthy and eight SoJIA samples were used as training set to generate a list of 50 classifier genes displaying the best ability to discriminate SoJIA patients from healthy controls. Those classifier genes were hierarchically clustered in a test set composed of 35 healthy controls, 16 SoJIA, 31 S. aureus, 12 S. pneumoniae, 31 E. coli, 18 Influenza A and 38 SLE patients. (B) Genes expressed at statistically different levels in SoJIA patients compared to healthy volunteers (p<0.01, Wilcoxon-Mann-Whitney test) were selected (4311 probe sets). Out of those, 88 were found expressed at statistically different levels in SoJIA patients compared to healthy volunteers (p<0.01, Wilcoxon-Mann-Whitney test) but not in all the other groups (p>0.5, Wilcoxon-Mann-Whitney test). The 88 genes are hierarchically clustered in the 107 samples from different disease groups used in (A). Expression values or the genes are normalized per-gene to the healthy group (Published in Curr Opin Immunol. 2007 Dec;19(6):623-32)
Figure 8
Figure 8. Modular fingerprints of human immune-mediated diseases
A. Expression levels of 4 groups of transcriptionally co-regulated genes in PBMCs of healthy children and children with SLE are shown in the upper panel. Transcripts within modules 2.2 (neutrophil-related transcripts) and 3.1 (type I IFN-inducible transcripts) are upregulated while 2.4 (ribosomal protein-encoding transcripts) and 2.8 (T cell –related transcripts) are downregulated in the majority of SLE patients. These differentially expressed modules and 7 additional ones are represented on a greed as red (over expressed) or blue (under expressed) circles. The intensity of the colour reflects the percentage of transcripts within each module that are significantly differentially expressed. Statistical comparisons between patient and healthy control groups were performed independently on a module-by-module basis (Mann-Whitney rank test, p<0.05). B. Modular analysis of PBMC differential gene expression in patients with Melanoma, liver transplant under immunosuppression, and S. pneumoniae infection. The colour code of modules containing transcripts with annotated function is depicted in the lower right quadrant. (Adapted from Immunity. 2008 July 18; 29(1): 150–164).
Figure 9
Figure 9. Development of transcriptome-based SLE disease activity biomarkers
Starting from a full set of 28 modules, 11 modules for which a minimum proportion of transcripts (>15%) are significantly changed (p<0.05) between the study groups (SLE and healthy) are selected. Next, composite values for each sample are generated by calculating the arithmetic average of normalized expression values across significantly over-expressed or under-expressed genes selected from each module. Each resulting “transcriptional vector” recapitulates the expression of a given module (or select set of genes within a module) in a given patient. A spider graph connecting all the vector values in untreated (average in orange) and treated (average in green) patients is shown. The values are normalized per-gene using the median expression value of healthy and are represented on a logarithmic scale. A non-parametric method for analyzing multivariate ordinal data was then used to score the patients based on 5/11 vectors that best correlated individually with SLE disease activity according to the SLEDAI. The correlation achieved by this score was superior to that of its individual components. Upon longitudinal follow-up of patients, parallel trends were observed between transcriptional scores and SLEDAI longitudinal measures in a majority of patients. Disease flaring and subsequent recovery was detected in one patient (SLE31) upon longitudinal follow up using both SLEDAI and transcriptional score. Interestingly, however, the amplitude of change observed in the case of the transcriptional U-score appears not only to be much greater (0 to 40 vs. 6 to 10 for SLEDAI), but an increase could already be detected at the second time point, 2 months before the worsening of the clinical condition of this patient was detected by SLEDAI. One of the patients (SLE78) showing discrepancy between the SLEDAI (low) and transcriptional score (high) was diagnosed during the follow-up period with a life-threatening complication (pulmonary hypertension) which is not computed within the SLEDAI. Thus, severity of disease was more accurately assessed by the transcriptional score.

Similar articles

Cited by

References

    1. Davis MM. A prescription for human immunology. Immunity. 2008;29:835–8. - PMC - PubMed
    1. Liu K, Mohan C. What do mouse models teach us about human SLE? Clin Immunol. 2006;119:123–30. - PubMed
    1. Horai R, Saijo S, Tanioka H, Nakae S, Sudo K, Okahara A, Ikuse T, Asano M, Iwakura Y. Development of chronic inflammatory arthropathy resembling rheumatoid arthritis in interleukin 1 receptor antagonist-deficient mice. J Exp Med. 2000;191:313–20. - PMC - PubMed
    1. Mertens M, Singh JA. Anakinra for rheumatoid arthritis: a systematic review. J Rheumatol. 2009;36:1118–25. - PubMed
    1. Feldmann M, Maini RN. Anti-TNF alpha therapy of rheumatoid arthritis: what have we learned? Annu Rev Immunol. 2001;19:163–96. - PubMed

Publication types