CD4+CD25+ regulatory T cells in autoimmune arthritis
- PMID: 20192995
- PMCID: PMC2908310
- DOI: 10.1111/j.0105-2896.2009.00848.x
CD4+CD25+ regulatory T cells in autoimmune arthritis
Abstract
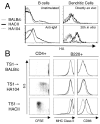
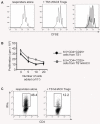
CD4(+)CD25(+) regulatory T (Treg) cells can play a critical role in the prevention of autoimmunity, as evidenced by the cataclysmic autoimmune disease that develops in mice and humans lacking the key transcription factor forkhead box protein 3 (Foxp3). At present, however, how and whether Treg cells participate in the development of rheumatoid arthritis (RA), which has both systemic manifestations and a joint-targeted pathology that characterizes the disease, remains unclear. In this review, we describe work that has been carried out aimed at determining the role of Treg cells in disease development in RA patients and in mouse models of inflammatory arthritis. We also describe studies in a new model of spontaneous autoimmune arthritis (TS1 x HACII mice), in which disease is caused by CD4(+) T cells recognizing a neo-self-antigen expressed by systemically distributed antigen-presenting cells. We show that TS1 x HACII mice develop arthritis despite the presence of CD4(+)CD25(+)Foxp3(+) Treg cells that recognize this target autoantigen, and we outline steps in the development of arthritis at which Treg cells might potentially act, or fail to act, in the development of inflammatory arthritis.
Figures


Similar articles
-
Daurinol Attenuates Autoimmune Arthritis via Stabilization of Nrp1-PTEN-Foxp3 Signaling in Regulatory T Cells.Front Immunol. 2019 Jul 17;10:1526. doi: 10.3389/fimmu.2019.01526. eCollection 2019. Front Immunol. 2019. PMID: 31379809 Free PMC article.
-
CD4+CD25high T cell numbers are enriched in the peripheral blood of patients with rheumatoid arthritis.Cell Immunol. 2008 May-Jun;253(1-2):92-101. doi: 10.1016/j.cellimm.2008.05.007. Epub 2008 Jul 22. Cell Immunol. 2008. PMID: 18649874 Free PMC article.
-
(99) Tc-methylene diphosphonate improves rheumatoid arthritis disease activity by increasing the frequency of peripheral γδ T cells and CD4(+) CD25(+) Foxp3(+) Tregs.Int J Rheum Dis. 2016 Jun;19(6):586-93. doi: 10.1111/1756-185X.12292. Epub 2014 Jan 28. Int J Rheum Dis. 2016. PMID: 24467668
-
Natural regulatory T cells in autoimmunity.Autoimmunity. 2011 Feb;44(1):33-42. doi: 10.3109/08916931003782155. Epub 2010 Nov 23. Autoimmunity. 2011. PMID: 21091291 Free PMC article. Review.
-
Manipulating regulatory T cells: a promising strategy to treat autoimmunity.Immunotherapy. 2015;7(11):1201-11. doi: 10.2217/imt.15.79. Epub 2015 Nov 16. Immunotherapy. 2015. PMID: 26568117 Free PMC article. Review.
Cited by
-
Efficacy and Feasibility of Programmed Death-1/Programmed Death Ligand-1 Blockade Therapy in Non-Small Cell Lung Cancer Patients With High Antinuclear Antibody Titers.Front Oncol. 2021 Mar 15;11:610952. doi: 10.3389/fonc.2021.610952. eCollection 2021. Front Oncol. 2021. PMID: 33791204 Free PMC article.
-
Investigate pathogenic mechanism of TXNDC5 in rheumatoid arthritis.PLoS One. 2013;8(1):e53301. doi: 10.1371/journal.pone.0053301. Epub 2013 Jan 9. PLoS One. 2013. PMID: 23326410 Free PMC article.
-
Therapeutic Efficacy of Mesenchymal Stem/Stromal Cell Small Extracellular Vesicles in Alleviating Arthritic Progression by Restoring Macrophage Balance.Biomolecules. 2023 Oct 10;13(10):1501. doi: 10.3390/biom13101501. Biomolecules. 2023. PMID: 37892183 Free PMC article.
-
The role of T-cell receptor recognition of peptide:MHC complexes in the formation and activity of Foxp3⁺ regulatory T cells.Immunol Rev. 2014 May;259(1):11-22. doi: 10.1111/imr.12177. Immunol Rev. 2014. PMID: 24712456 Free PMC article. Review.
-
Osteoimmunology: The correlation between osteoclasts and the Th17/Treg balance in osteoporosis.J Cell Mol Med. 2022 Jul;26(13):3591-3597. doi: 10.1111/jcmm.17399. Epub 2022 May 28. J Cell Mol Med. 2022. PMID: 35633138 Free PMC article. Review.
References
-
- Alt FW, Blackwell TK, Yancopoulos GD. Development of the primary antibody repertoire. Science. 1987;238:1079–1087. - PubMed
-
- Davis MM, Bjorkman PJ. T-cell antigen receptor genes and T-cell recognition. Nature. 1988;334:395–402. - PubMed
-
- Seder RA, Paul WE. Acquisition of lymphokine-producing phenotype by CD4+ T cells. Annu Rev Immunol. 1994;12:635–673. - PubMed
-
- Nossal GJ. Negative selection of lymphocytes. Cell. 1994;76:229–239. - PubMed
-
- Sakaguchi S. Regulatory T cells: key controllers of immunologic self-tolerance. Cell. 2000;101:455–458. - PubMed
Publication types
MeSH terms
Substances
Grants and funding
LinkOut - more resources
Full Text Sources
Other Literature Sources
Medical
Research Materials

