

High-resolution transcription atlas of the mitotic cell cycle in budding yeast
- PMID: 20193063
- PMCID: PMC2864564
- DOI: 10.1186/gb-2010-11-3-r24
High-resolution transcription atlas of the mitotic cell cycle in budding yeast
Abstract
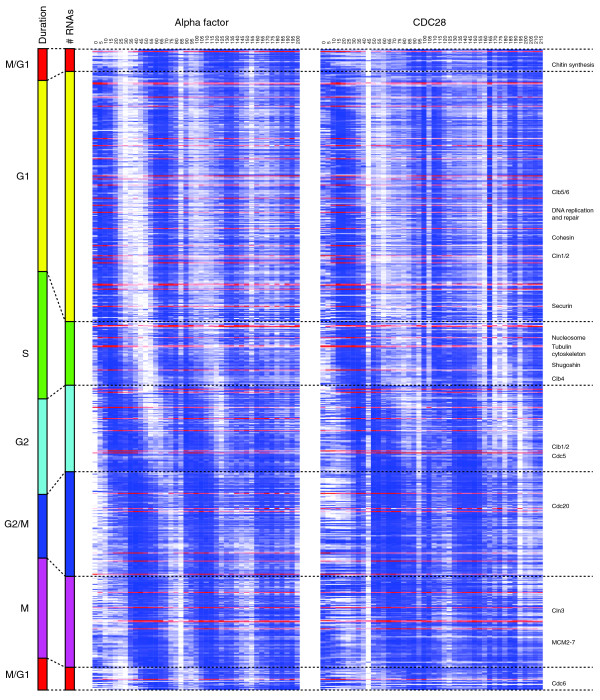
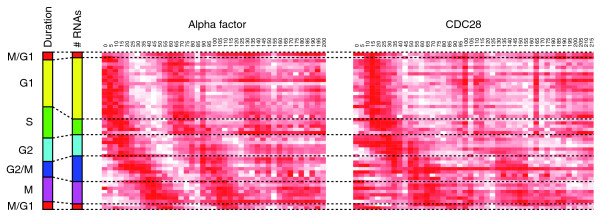
Background: Extensive transcription of non-coding RNAs has been detected in eukaryotic genomes and is thought to constitute an additional layer in the regulation of gene expression. Despite this role, their transcription through the cell cycle has not been studied; genome-wide approaches have only focused on protein-coding genes. To explore the complex transcriptome architecture underlying the budding yeast cell cycle, we used 8 bp tiling arrays to generate a 5 minute-resolution, strand-specific expression atlas of the whole genome.
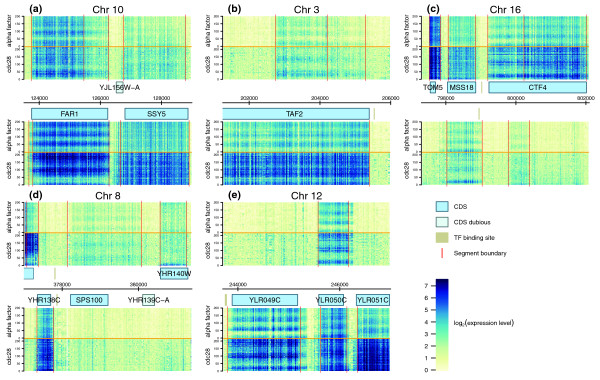
Results: We discovered 523 antisense transcripts, of which 80 cycle or are located opposite periodically expressed mRNAs, 135 unannotated intergenic non-coding RNAs, of which 11 cycle, and 109 cell-cycle-regulated protein-coding genes that had not previously been shown to cycle. We detected periodic expression coupling of sense and antisense transcript pairs, including antisense transcripts opposite of key cell-cycle regulators, like FAR1 and TAF2.
Conclusions: Our dataset presents the most comprehensive resource to date on gene expression during the budding yeast cell cycle. It reveals periodic expression of both protein-coding and non-coding RNA and profiles the expression of non-annotated RNAs throughout the cell cycle for the first time. This data enables hypothesis-driven mechanistic studies concerning the functions of non-coding RNAs.
Figures

References
-
- Kampa D, Cheng J, Kapranov P, Yamanaka M, Brubaker S, Cawley S, Drenkow J, Piccolboni A, Bekiranov S, Helt G, Tammana H, Gingeras TR. Novel RNAs identified from an in-depth analysis of the transcriptome of human chromosomes 21 and 22. Genome Res. 2004;14:331–342. doi: 10.1101/gr.2094104. - DOI - PMC - PubMed
-
- Kapranov P, Cheng J, Dike S, Nix DA, Duttagupta R, Willingham AT, Stadler PF, Hertel J, Hackermuller J, Hofacker IL, Bell I, Cheung E, Drenkow J, Dumais E, Patel S, Helt G, Ganesh M, Ghosh S, Piccolboni A, Sementchenko V, Tammana H, Gingeras TR. RNA maps reveal new RNA classes and a possible function for pervasive transcription. Science. 2007;316:1484–1488. doi: 10.1126/science.1138341. - DOI - PubMed
-
- Schadt EE, Edwards SW, GuhaThakurta D, Holder D, Ying L, Svetnik V, Leonardson A, Hart KW, Russell A, Li G, Cavet G, Castle J, McDonagh P, Kan Z, Chen R, Kasarskis A, Margarint M, Caceres RM, Johnson JM, Armour CD, Garrett-Engele PW, Tsinoremas NF, Shoemaker DD. A comprehensive transcript index of the human genome generated using microarrays and computational approaches. Genome Biol. 2004;5:R73. doi: 10.1186/gb-2004-5-10-r73. - DOI - PMC - PubMed
-
- Yelin R, Dahary D, Sorek R, Levanon EY, Goldstein O, Shoshan A, Diber A, Biton S, Tamir Y, Khosravi R, Nemzer S, Pinner E, Walach S, Bernstein J, Savitsky K, Rotman G. Widespread occurrence of antisense transcription in the human genome. Nat Biotechnol. 2003;21:379–386. doi: 10.1038/nbt808. - DOI - PubMed
Publication types
MeSH terms
Substances
LinkOut - more resources
Full Text Sources
Other Literature Sources
Molecular Biology Databases
