

Probabilistic Modeling of Dietary Arsenic Exposure and Dose and Evaluation with 2003-2004 NHANES Data
- PMID: 20194069
- PMCID: PMC2854761
- DOI: 10.1289/ehp.0901205
Probabilistic Modeling of Dietary Arsenic Exposure and Dose and Evaluation with 2003-2004 NHANES Data
Abstract
Background: Dietary exposure from food to toxic inorganic arsenic (iAs) in the general U.S. population has not been well studied.
Objectives: The goal of this research was to quantify dietary As exposure and analyze the major contributors to total As (tAs) and iAs. Another objective was to compare model predictions with observed data.
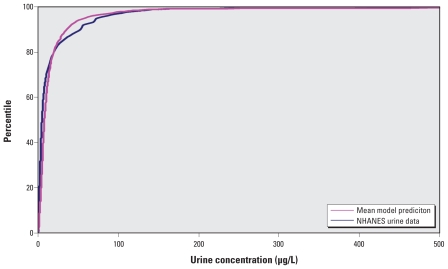
Methods: Probabilistic exposure modeling for dietary As was conducted with the Stochastic Human Exposure and Dose Simulation Dietary (SHEDS-Dietary) model, based on data from the National Health and Nutrition Examination Survey. The dose modeling was conducted by combining the SHEDS-Dietary model with the MENTOR-3P (Modeling ENvironment for TOtal Risk with Physiologically Based Pharmacokinetic Modeling for Populations) system. Model evaluation was conducted via comparing exposure and dose-modeling predictions against duplicate diet data and biomarker measurements, respectively, for the same individuals.
Results: The mean modeled tAs exposure from food is 0.38 microg/kg/day, which is approximately 14 times higher than the mean As exposures from the drinking water. The mean iAs exposure from food is 0.05 microg/kg/day (1.96 microg/day), which is approximately two times higher than the mean iAs exposures from the drinking water. The modeled exposure and dose estimates matched well with the duplicate diet data and measured As biomarkers. The major food contributors to iAs exposure were the following: vegetables (24%); fruit juices and fruits (18%); rice (17%); beer and wine (12%); and flour, corn, and wheat (11%). Approximately 10% of tAs exposure from foods is the toxic iAs form.
Conclusions: The general U.S. population may be exposed to tAs and iAs more from eating some foods than from drinking water. In addition, this model evaluation effort provides more confidence in the exposure assessment tools used.
Figures


Comment in
-
Probabilistic modeling of dietary arsenic exposure.Environ Health Perspect. 2010 Aug;118(8):a331-2; author reply a332. doi: 10.1289/ehp.1002328. Environ Health Perspect. 2010. PMID: 20682477 Free PMC article. No abstract available.
References
-
- Abernathy CO, Thomas DJ, Calderon RL. Health effects and risk assessment of arsenic. J Nutr. 2003;133(5 suppl 1):1536S–1538S. - PubMed
-
- Anetor JI, Wanibuchi H, Fukushima S. Arsenic exposure and its health effects and risk of cancer in developing countries: micronutrients as host defence. Asian Pac J Cancer Prev. 2007;8(1):13–23. - PubMed
-
- Agricultural Research Service. Continuing Survey of Food Intakes by Individuals (CSFII), 1994–1996, 1998. 2009. [[accessed 16 November 2009]]. Available: http://sodapop.pop.psu.edu/data-collections/csfii.
-
- Boyce CP, Lewis AS, Sax SN, Eldan M, Cohen SM, Becj BD. Probabilistic analysis of human health risks associated with background concentrations of inorganic arsenic: use of a margin of exposure approach. Hum Ecol Risk Assess. 2008;14:1159–1201.
Publication types
MeSH terms
Substances
Grants and funding
LinkOut - more resources
Full Text Sources
Medical
Research Materials