

Traffic-related air pollution and QT interval: modification by diabetes, obesity, and oxidative stress gene polymorphisms in the normative aging study
- PMID: 20194081
- PMCID: PMC2898862
- DOI: 10.1289/ehp.0901396
Traffic-related air pollution and QT interval: modification by diabetes, obesity, and oxidative stress gene polymorphisms in the normative aging study
Abstract
Background: Acute exposure to ambient air pollution has been associated with acute changes in cardiac outcomes, often within hours of exposure.
Objectives: We examined the effects of air pollutants on heart-rate-corrected QT interval (QTc), an electrocardiographic marker of ventricular repolarization, and whether these associations were modified by participant characteristics and genetic polymorphisms related to oxidative stress.
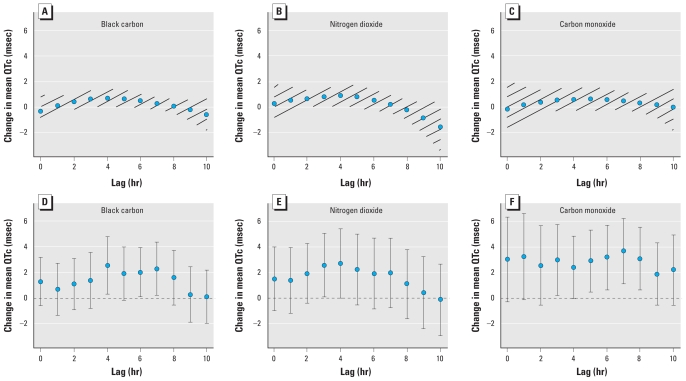
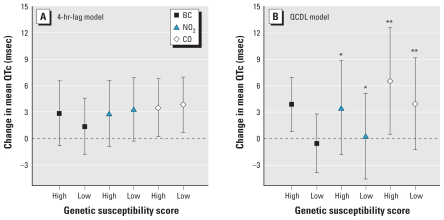
Methods: We studied repeated measurements of QTc on 580 men from the Veterans Affairs Normative Aging Study (NAS) using mixed-effects models with random intercepts. We fitted a quadratic constrained distributed lag model to estimate the cumulative effect on QTc of ambient air pollutants including fine particulate matter <or= 2.5 microm in aerodynamic diameter (PM2.5), ozone (O3), black carbon (BC), nitrogen dioxide (NO2), carbon monoxide (CO), and sulfur dioxide (SO2) concentrations during the 10 hr before the visit. We genotyped polymorphisms related to oxidative stress and analyzed pollution-susceptibility score interactions using the genetic susceptibility score (GSS) method.
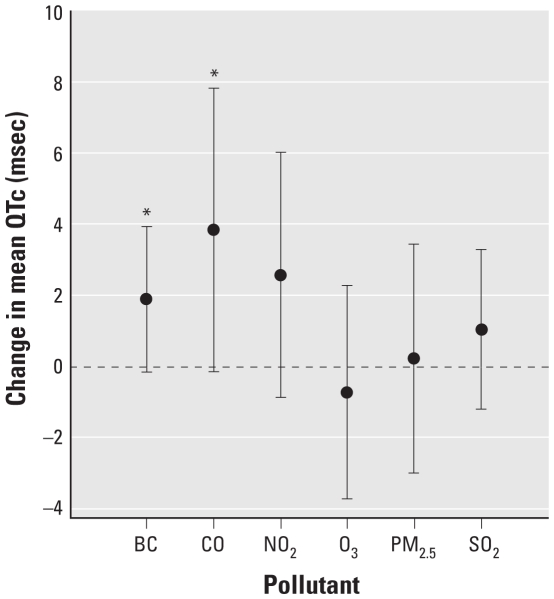
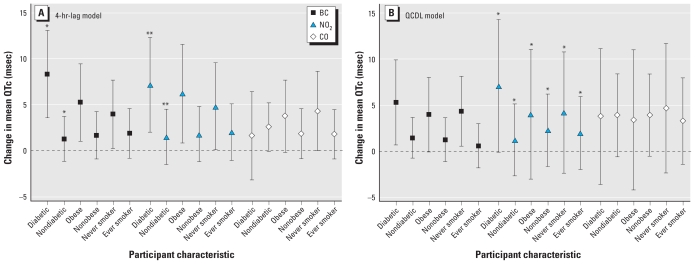
Results: Ambient traffic pollutant concentrations were related to longer QTc. An interquartile range (IQR) change in BC cumulative during the 10 hr before the visit was associated with increased QTc [1.89 msec change; 95% confidence interval (CI), -0.16 to 3.93]. We found a similar association with QTc for an IQR change in 1-hr BC that occurred 4 hr before the visit (2.54 msec change; 95% CI, 0.28-4.80). We found increased QTc for IQR changes in NO2 and CO, but the change was statistically insignificant. In contrast, we found no association between QTc and PM2.5, SO2, and O3. The association between QTc and BC was stronger among participants who were obese, who had diabetes, who were nonsmokers, or who had higher GSSs.
Conclusions: Traffic-related pollutants may increase QTc among persons with diabetes, persons who are obese, and nonsmoking elderly individuals; the number of genetic variants related to oxidative stress increases this effect.
Figures
References
-
- Al-Khatib SM, LaPointe NM, Kramer JM, Califf RM. What clinicians should know about the QT interval. JAMA. 2003;289(16):2120–2127. - PubMed
-
- Alm S, Jantunen MJ, Vartiainen M. Urban commuter exposure to particle matter and carbon monoxide inside an automobile. J Expo Anal Environ Epidemiol. 1999;9(3):237–244. - PubMed
-
- Andrassy G, Szabo A, Dunai A, Simon E, Nagy T, Trummer Z, et al. Acute effects of cigarette smoking on the QT interval in healthy smokers. Am J Cardiol. 2003;92(4):489–492. - PubMed
-
- Bai Y, Suzuki AK, Sagai M. The cytotoxic effects of diesel exhaust particles on human pulmonary artery endothelial cells in vitro: role of active oxygen species. Free Radic Biol Med. 2001;30(5):555–562. - PubMed
Publication types
MeSH terms
Substances
Grants and funding
LinkOut - more resources
Full Text Sources
Miscellaneous