

Spatial, temporal and interindividual epigenetic variation of functionally important DNA methylation patterns
- PMID: 20194112
- PMCID: PMC2896520
- DOI: 10.1093/nar/gkq126
Spatial, temporal and interindividual epigenetic variation of functionally important DNA methylation patterns
Abstract
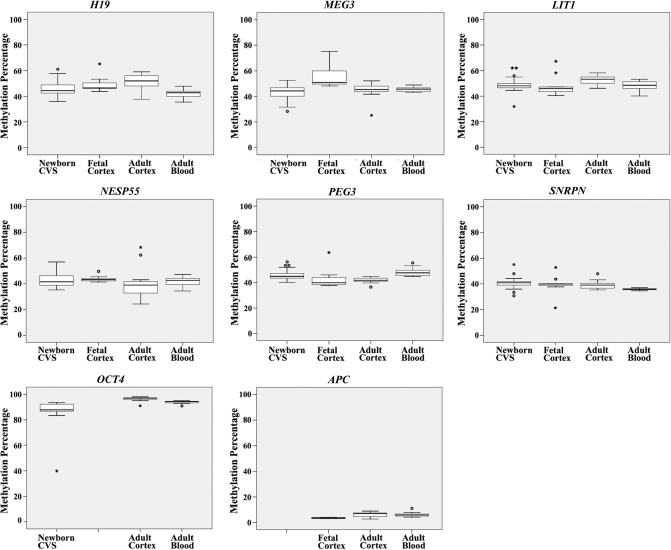
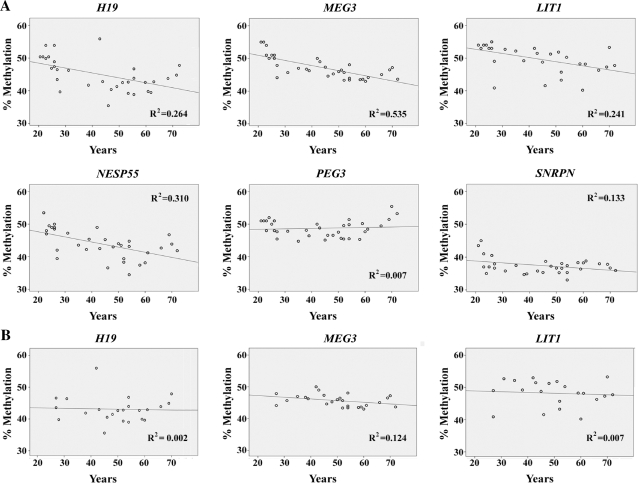
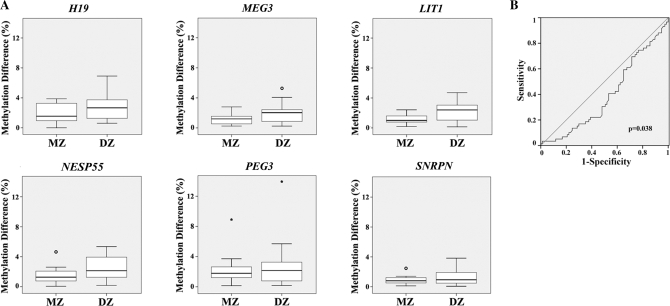
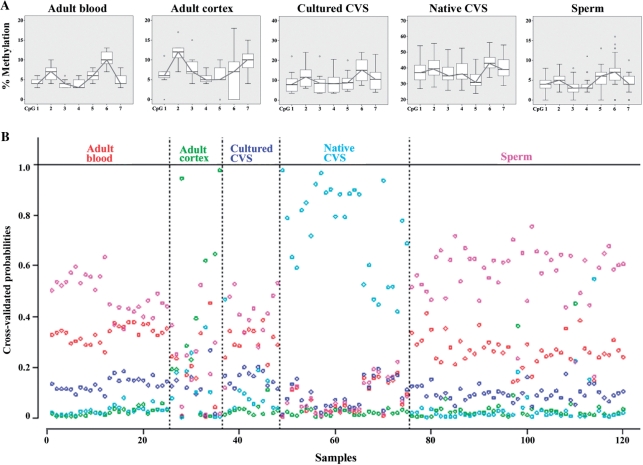
DNA methylation is an epigenetic modification that plays an important role in gene regulation. It can be influenced by stochastic events, environmental factors and developmental programs. However, little is known about the natural variation of gene-specific methylation patterns. In this study, we performed quantitative methylation analyses of six differentially methylated imprinted genes (H19, MEG3, LIT1, NESP55, PEG3 and SNRPN), one hypermethylated pluripotency gene (OCT4) and one hypomethylated tumor suppressor gene (APC) in chorionic villus, fetal and adult cortex, and adult blood samples. Both average methylation level and range of methylation variation depended on the gene locus, tissue type and/or developmental stage. We found considerable variability of functionally important methylation patterns among unrelated healthy individuals and a trend toward more similar methylation levels in monozygotic twins than in dizygotic twins. Imprinted genes showed relatively little methylation changes associated with aging in individuals who are >25 years. The relative differences in methylation among neighboring CpGs in the generally hypomethylated APC promoter may not only reflect stochastic fluctuations but also depend on the tissue type. Our results are consistent with the view that most methylation variation may arise after fertilization, leading to epigenetic mosaicism.
Figures
Similar articles
-
Quantitative methylation analysis of developmentally important genes in human pregnancy losses after ART and spontaneous conception.Mol Hum Reprod. 2010 Sep;16(9):704-13. doi: 10.1093/molehr/gap107. Epub 2009 Dec 9. Mol Hum Reprod. 2010. PMID: 20007506
-
Impact of the genome on the epigenome is manifested in DNA methylation patterns of imprinted regions in monozygotic and dizygotic twins.PLoS One. 2011;6(10):e25590. doi: 10.1371/journal.pone.0025590. Epub 2011 Oct 3. PLoS One. 2011. PMID: 21991322 Free PMC article.
-
Placentas from pregnancies conceived by IVF/ICSI have a reduced DNA methylation level at the H19 and MEST differentially methylated regions.Hum Reprod. 2013 Apr;28(4):1117-26. doi: 10.1093/humrep/des459. Epub 2013 Jan 22. Hum Reprod. 2013. PMID: 23343754
-
Epigenetic discordance at imprinting control regions in twins.Epigenomics. 2011 Jun;3(3):295-306. doi: 10.2217/epi.11.18. Epigenomics. 2011. PMID: 22122339 Review.
-
Imprinting of the mouse Igf2r gene depends on an intronic CpG island.Mol Cell Endocrinol. 1998 May 25;140(1-2):9-14. doi: 10.1016/s0303-7207(98)00022-7. Mol Cell Endocrinol. 1998. PMID: 9722161 Review.
Cited by
-
Metabolic programming of MEST DNA methylation by intrauterine exposure to gestational diabetes mellitus.Diabetes. 2013 Apr;62(4):1320-8. doi: 10.2337/db12-0289. Epub 2012 Dec 3. Diabetes. 2013. PMID: 23209187 Free PMC article.
-
Inter-individual methylation variability in differentially methylated regions between maternal whole blood and first trimester CVS.Mol Cytogenet. 2014 Nov 1;7(1):73. doi: 10.1186/s13039-014-0073-8. eCollection 2014. Mol Cytogenet. 2014. PMID: 25426166 Free PMC article.
-
Effect of dynamic DNA methylation and histone acetylation on cPouV expression in differentiation of chick embryonic germ cells.Stem Cells Dev. 2013 Oct 15;22(20):2725-35. doi: 10.1089/scd.2013.0046. Epub 2013 Jul 17. Stem Cells Dev. 2013. PMID: 23750509 Free PMC article.
-
Longitudinal, genome-scale analysis of DNA methylation in twins from birth to 18 months of age reveals rapid epigenetic change in early life and pair-specific effects of discordance.Genome Biol. 2013 May 22;14(5):R42. doi: 10.1186/gb-2013-14-5-r42. Genome Biol. 2013. PMID: 23697701 Free PMC article.
-
The evolutionary biology of child health.Proc Biol Sci. 2011 May 22;278(1711):1441-9. doi: 10.1098/rspb.2010.2627. Epub 2011 Feb 2. Proc Biol Sci. 2011. PMID: 21288946 Free PMC article. Review.
References
-
- Gärtner K, Baunack E. Is the similarity of monozygotic twins due to genetic factors alone? Nature. 1981;292:646–764. - PubMed
-
- Gärtner K. A third component causing random variability beside environment and genotype.. A reason for the limited success of a 30 year long effort to standardize laboratory animals? Lab Anim. 1990;24:71–77. - PubMed
-
- Yanagimachi R. Cloning: experience from the mouse and other animals. Mol. Cell. Endocrinol. 2002;187:241–248. - PubMed
-
- Wong AH, Gottesman II, Petronis A. Phenotypic differences in genetically identical organisms: the epigenetic perspective. Hum. Mol. Genet. 2005;14:R11–18. - PubMed
-
- Sutherland JE, Costa M. Epigenetics and the environment. Ann. NY Acad. Sci. 2003;983:151–160. - PubMed
