Into the unknown: expression profiling without genome sequence information in CHO by next generation sequencing
- PMID: 20194116
- PMCID: PMC2896516
- DOI: 10.1093/nar/gkq116
Into the unknown: expression profiling without genome sequence information in CHO by next generation sequencing
Abstract
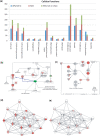
The arrival of next-generation sequencing (NGS) technologies has led to novel opportunities for expression profiling and genome analysis by utilizing vast amounts of short read sequence data. Here, we demonstrate that expression profiling in organisms lacking any genome or transcriptome sequence information is feasible by combining Illumina's mRNA-seq technology with a novel bioinformatics pipeline that integrates assembled and annotated Chinese hamster ovary (CHO) sequences with information derived from related organisms. We applied this pipeline to the analysis of CHO cells which were chosen as a model system owing to its relevance in the production of therapeutic proteins. Specifically, we analysed CHO cells undergoing butyrate treatment which is known to affect cell cycle regulation and to increase the specific productivity of recombinant proteins. By this means, we identified sequences for >13,000 CHO genes which added sequence information of approximately 5000 novel genes to the CHO model. More than 6000 transcript sequences are predicted to be complete, as they covered >95% of the corresponding mouse orthologs. Detailed analysis of selected biological functions such as DNA replication and cell cycle control, demonstrated the potential of NGS expression profiling in organisms without extended genome sequence to improve both data quantity and quality.
Figures


Similar articles
-
A Bioinformatics Pipeline for the Identification of CHO Cell Differential Gene Expression from RNA-Seq Data.Methods Mol Biol. 2017;1603:169-186. doi: 10.1007/978-1-4939-6972-2_11. Methods Mol Biol. 2017. PMID: 28493130
-
Towards next generation CHO cell biology: Bioinformatics methods for RNA-Seq-based expression profiling.Biotechnol J. 2015 Jul;10(7):950-66. doi: 10.1002/biot.201500107. Epub 2015 Jun 9. Biotechnol J. 2015. PMID: 26058739 Review.
-
Genomic and proteomic exploration of CHO and hybridoma cells under sodium butyrate treatment.Biotechnol Bioeng. 2008 Apr 1;99(5):1186-204. doi: 10.1002/bit.21665. Biotechnol Bioeng. 2008. PMID: 17929327
-
Comparative transcriptional analysis of mouse hybridoma and recombinant Chinese hamster ovary cells undergoing butyrate treatment.J Biosci Bioeng. 2007 Jan;103(1):82-91. doi: 10.1263/jbb.103.82. J Biosci Bioeng. 2007. PMID: 17298905
-
The 'Omics Revolution in CHO Biology: Roadmap to Improved CHO Productivity.Methods Mol Biol. 2017;1603:153-168. doi: 10.1007/978-1-4939-6972-2_10. Methods Mol Biol. 2017. PMID: 28493129 Review.
Cited by
-
Comprehensive Glycoproteomic Analysis of Chinese Hamster Ovary Cells.Anal Chem. 2018 Dec 18;90(24):14294-14302. doi: 10.1021/acs.analchem.8b03520. Epub 2018 Dec 3. Anal Chem. 2018. PMID: 30457839 Free PMC article.
-
Evaluation of PepT1 (SLC15A1) Substrate Characteristics of Therapeutic Cyclic Peptides.Pharmaceutics. 2022 Aug 1;14(8):1610. doi: 10.3390/pharmaceutics14081610. Pharmaceutics. 2022. PMID: 36015235 Free PMC article.
-
De novo assembly and analysis of RNA-seq data.Nat Methods. 2010 Nov;7(11):909-12. doi: 10.1038/nmeth.1517. Epub 2010 Oct 10. Nat Methods. 2010. PMID: 20935650
-
De novo analysis of transcriptome dynamics in the migratory locust during the development of phase traits.PLoS One. 2010 Dec 30;5(12):e15633. doi: 10.1371/journal.pone.0015633. PLoS One. 2010. PMID: 21209894 Free PMC article.
-
Transcriptomic Insights Into Serum-Free Medium Adaptation and Temperature Reduction in Chinese Hamster Ovary Cell Cultures.Biotechnol J. 2025 Jul;20(7):e70055. doi: 10.1002/biot.70055. Biotechnol J. 2025. PMID: 40611689 Free PMC article.
References
-
- Metzker ML. Sequencing technologies – the next generation. Nat. Rev. Genet. 2010;11:31–46. - PubMed
-
- Shendure J, Ji H. Next-generation DNA sequencing. Nat. Biotechnol. 2008;26:1135–1145. - PubMed
-
- Mortazavi A, Williams BA, McCue K, Schaeffer L, Wold B. Mapping and quantifying mammalian transcriptomes by RNA-Seq. Nat. Methods. 2008;5:621–628. - PubMed
Publication types
MeSH terms
Substances
LinkOut - more resources
Full Text Sources
Other Literature Sources

