

Patterns of multiple myeloma during the past 5 decades: stable incidence rates for all age groups in the population but rapidly changing age distribution in the clinic
- PMID: 20194150
- PMCID: PMC2843108
- DOI: 10.4065/mcp.2009.0426
Patterns of multiple myeloma during the past 5 decades: stable incidence rates for all age groups in the population but rapidly changing age distribution in the clinic
Abstract
Objective: To define age-adjusted incidence trends in multiple myeloma (MM) in a well-characterized population during a long period, given that some, but not all, studies have reported increasing MM incidence over time and that clinical experience from some centers suggests an increased incidence mainly in younger age groups.
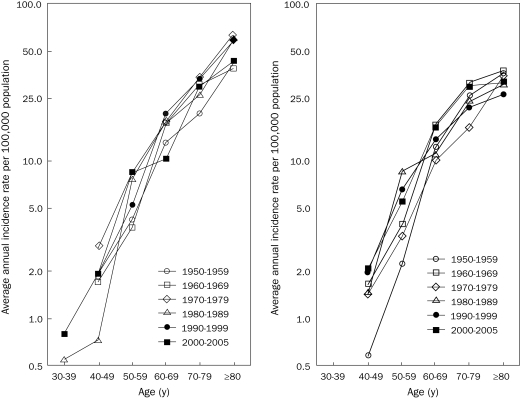
Patients and methods: We identified all patients (N=773) with MM diagnosed in Malmö, Sweden, from January 1, 1950, through December 31, 2005. Using census data for the population of Malmö, we calculated age- and sex-specific incidence rates. Incidence rates were also calculated for 10-year birth cohorts. Analyses for trends were performed using the Poisson regression.
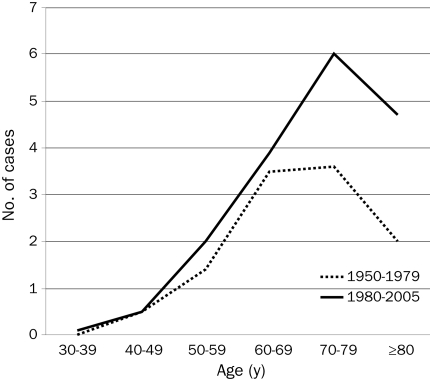
Results: From 1950 through 2005, the average annual age-adjusted (European standard population) incidence rate remained stable (Poisson regression, P=.07 for men and P=.67 for women). Also, comparisons between 10-year birth cohorts (from 1870-1879 to 1970-1979) failed to detect any increase. Between 1950-1959 and 2000-2005, the median age at diagnosis of MM increased from 70 to 74 years, and the proportion of newly diagnosed patients aged 80 years or older increased from 16% to 31%.
Conclusion: Our finding of stable MM incidence rates for all age groups during the past 5 decades suggests that recent clinical observations of an increase of MM in the young may reflect an increased referral stream of younger patients with MM, which in turn might be a consequence of improved access to better MM therapies. Importantly, because of the aging population, the proportion of patients with MM aged 80 years or older doubled between 1950-1959 and 2000-2005.
Figures
References
-
- Greenlee RT, Murray T, Bolden S, Wingo PA. Cancer Statistics 2000. CA Cancer J Clin. 2000;50:7-33_ - PubMed
-
- Kyle RA, Therneau TM, Rajkumar SV, Larson DR, Plevak MF, Melton LJ., III Incidence of multiple myeloma in Olmsted County, Minnesota: trend over 6 decades. Cancer 2004;101:2667-2674 - PubMed
-
- Landgren O, Weiss BM. Patterns of monoclonal gammopathy of undetermined significance and multiple myeloma in various ethnic/racial groups: support for genetic factors in pathogenesis. Leukemia 2009;23(10):1691-1697 Epub 2009 Jul 9 - PubMed
-
- Lewis DR, Pottern LM, Brown LM, et al. Multiple myeloma among blacks and whites in the United States: the role of chronic antigenic stimulation. Cancer Causes Control. 1994;5:529-539 - PubMed
-
- Blattner WA, Blair A, Mason TJ. Multiple myeloma in the United States, 1950-1975. Cancer 1981;48:2547-2554 - PubMed
Publication types
MeSH terms
Grants and funding
LinkOut - more resources
Full Text Sources
Medical
Miscellaneous
