

The beak of the other finch: coevolution of genetic covariance structure and developmental modularity during adaptive evolution
- PMID: 20194173
- PMCID: PMC2830233
- DOI: 10.1098/rstb.2009.0285
The beak of the other finch: coevolution of genetic covariance structure and developmental modularity during adaptive evolution
Abstract
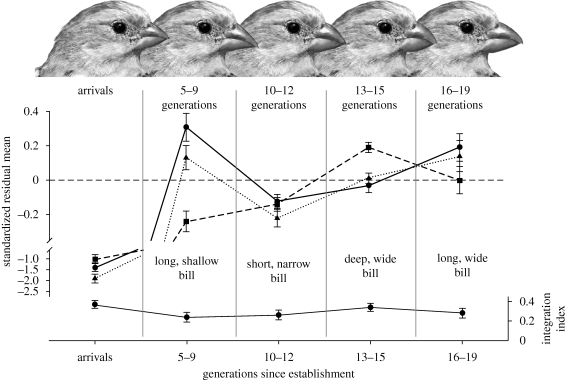
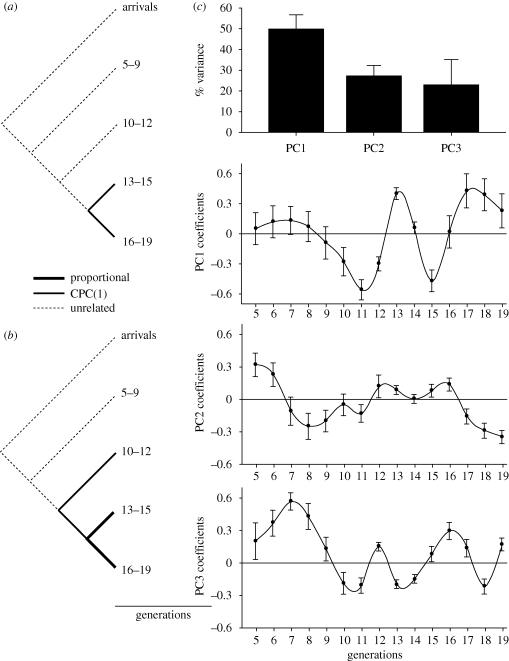
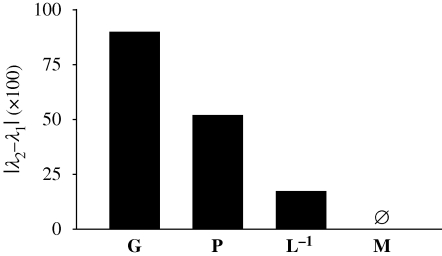
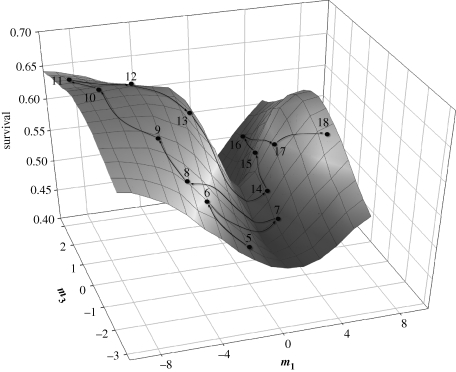
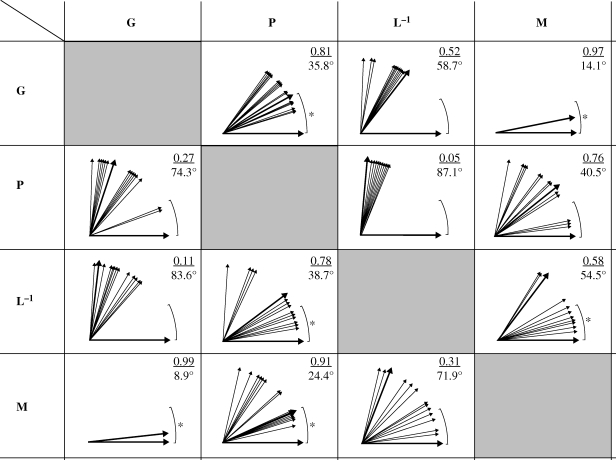
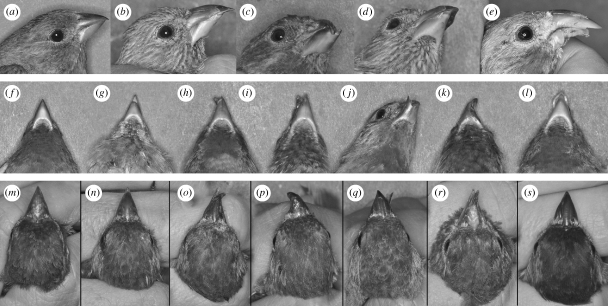
The link between adaptation and evolutionary change remains the most central and least understood evolutionary problem. Rapid evolution and diversification of avian beaks is a textbook example of such a link, yet the mechanisms that enable beak's precise adaptation and extensive adaptability are poorly understood. Often observed rapid evolutionary change in beaks is particularly puzzling in light of the neo-Darwinian model that necessitates coordinated changes in developmentally distinct precursors and correspondence between functional and genetic modularity, which should preclude evolutionary diversification. I show that during first 19 generations after colonization of a novel environment, house finches (Carpodacus mexicanus) express an array of distinct, but adaptively equivalent beak morphologies-a result of compensatory developmental interactions between beak length and width in accommodating microevolutionary change in beak depth. Directional selection was largely confined to the elimination of extremes formed by these developmental interactions, while long-term stabilizing selection along a single axis-beak depth-was mirrored in the structure of beak's additive genetic covariance. These results emphasize three principal points. First, additive genetic covariance structure may represent a historical record of the most recurrent developmental and functional interactions. Second, adaptive equivalence of beak configurations shields genetic and developmental variation in individual components from depletion by natural selection. Third, compensatory developmental interactions among beak components can generate rapid reorganization of beak morphology under novel conditions and thus greatly facilitate both the evolution of precise adaptation and extensive diversification, thereby linking adaptation and adaptability in this classic example of Darwinian evolution.
Figures
Similar articles
-
The calmodulin pathway and evolution of elongated beak morphology in Darwin's finches.Nature. 2006 Aug 3;442(7102):563-7. doi: 10.1038/nature04843. Nature. 2006. PMID: 16885984
-
Geometry and dynamics link form, function, and evolution of finch beaks.Proc Natl Acad Sci U S A. 2021 Nov 16;118(46):e2105957118. doi: 10.1073/pnas.2105957118. Proc Natl Acad Sci U S A. 2021. PMID: 34750258 Free PMC article.
-
QTL and quantitative genetic analysis of beak morphology reveals patterns of standing genetic variation in an Estrildid finch.Mol Ecol. 2012 Aug;21(15):3704-17. doi: 10.1111/j.1365-294X.2012.05661.x. Epub 2012 Jun 13. Mol Ecol. 2012. PMID: 22694741
-
Darwin's finches.Curr Biol. 2005 Aug 23;15(16):R614-5. doi: 10.1016/j.cub.2005.08.014. Curr Biol. 2005. PMID: 16111928 Review. No abstract available.
-
How to tweak a beak: molecular techniques for studying the evolution of size and shape in Darwin's finches and other birds.Bioessays. 2007 Jan;29(1):1-6. doi: 10.1002/bies.20517. Bioessays. 2007. PMID: 17187350 Review.
Cited by
-
FInCH: FIJI plugin for automated and scalable whole-image analysis of protein expression and cell morphology.MethodsX. 2024 Jul 9;13:102855. doi: 10.1016/j.mex.2024.102855. eCollection 2024 Dec. MethodsX. 2024. PMID: 39105087 Free PMC article.
-
Darwin's Galapagos finches in modern biology.Philos Trans R Soc Lond B Biol Sci. 2010 Apr 12;365(1543):1001-7. doi: 10.1098/rstb.2009.0321. Philos Trans R Soc Lond B Biol Sci. 2010. PMID: 20194163 Free PMC article.
-
A New Framework for Urban Ecology: An Integration of Proximate and Ultimate Responses to Anthropogenic Change.Integr Comp Biol. 2018 Nov 1;58(5):915-928. doi: 10.1093/icb/icy110. Integr Comp Biol. 2018. PMID: 30376106 Free PMC article.
-
Bigger or long-winged male common crossbills exhibit redder carotenoid-based plumage coloration.Curr Zool. 2022 May 18;69(2):165-172. doi: 10.1093/cz/zoac038. eCollection 2023 Apr. Curr Zool. 2022. PMID: 37091992 Free PMC article.
-
Developmental constraints on behavioural flexibility.Philos Trans R Soc Lond B Biol Sci. 2013 Apr 8;368(1618):20120350. doi: 10.1098/rstb.2012.0350. Print 2013 May 19. Philos Trans R Soc Lond B Biol Sci. 2013. PMID: 23569298 Free PMC article. Review.
References
-
- Abzhanov A., Protas M., Grant B. R., Grant P. R., Tabin C. J.2004Bmp4 and morphological variation of beaks in Darwin's finches. Science 305, 1462–1464 (doi:10.1126/science.1098095) - DOI - PubMed
-
- Abzhanov A., Kuo W. P., Hartmann C., Grant B. R., Grant P. R., Tabin C. J.2006The calmodulin pathway and evolution of elongated beak morphology in Darwin's finches. Nature 442, 563–567 (doi:10.1038/nature04843) - DOI - PubMed
-
- Abzhanov A., Rodda S. J., McMahon A. P., Tabin C. J.2007Regulation of skeletogenic differentiation in cranial dermal bone. Development 134, 3133–3144 (doi:10.1242/dev.002709) - DOI - PubMed
-
- Alfaro M. E., Bolnick D. I., Wainwright P. C.2005Evolutionary consequences of many-to-one mapping of jaw morphology to mechanics in labrid fishes. Am. Nat. 165, E140–E154 (doi:10.1086/429564) - DOI - PubMed
-
- Arnold S. J.1983Morphology, performance and fitness. Am. Zool. 23, 347–361
Publication types
MeSH terms
Substances
LinkOut - more resources
Full Text Sources
