Asynchronous muscle and tendon adaptation after surgical tensioning procedures
- PMID: 20194325
- PMCID: PMC2827824
- DOI: 10.2106/JBJS.I.00694
Asynchronous muscle and tendon adaptation after surgical tensioning procedures
Abstract
Background: Donor muscles are often highly stretched in tendon transfer surgery. Despite literature reports that showed adaptation of the serial sarcomere number to moderate stretch, little is known regarding adaptation to stretch outside of the physiological range (commonly seen in clinical tendon transfer). This study was performed to evaluate muscle-tendon-unit adaptation to tendon transfer surgery in an animal model.
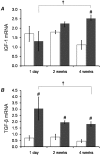
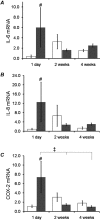
Methods: Thirty-seven male New Zealand White rabbits were used for muscle analysis, and twenty-five of those rabbits were also used for biological analysis of the tendons after the experiment. The extensor digitorum muscle of the second toe was transferred at a specific sarcomere length of 3.7 microm, chosen to be near the end of the descending limb of the rabbit sarcomere length-tension curve. Animals were killed at five time points, at which complete muscle architectural analysis as well as measurements of tendon dimension, tendon water content, and tendon cytokine transcript levels were performed.
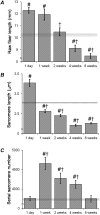
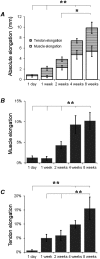
Results: As expected, a rapid increase in the serial sarcomere number (mean and standard error of the mean, 4658 +/- 154 in the transferred muscle compared with 3609 +/- 80 in the control muscle) was found one week after the surgery. From this time point until eight weeks, this increased serial sarcomere number paradoxically decreased, while the sarcomere length remained constant. Eventually, at eight weeks, it reached the same value (3749 +/- 83) as that in the control muscle (3767 +/- 61). Tendon adaptation was delayed relative to muscle adaptation, but it was no less dramatic. Tendon length increased by 1.43 +/- 0.74 mm over the eight-week time period, corresponding to a strain of 15.55% +/- 4.08%.
Conclusions: To our knowledge, this is the first report of biphasic adaptation of the serial sarcomere number followed by tendon adaptation, and it indicates that muscle adapts more quickly than tendon does. Taken together, these results illustrate a complex and unique interaction between muscles and tendons that occurs during adaptation to stretching during tendon transfer.
Figures

Similar articles
-
Effect of muscle tension during tendon transfer on sarcomerogenesis in a rabbit model.J Hand Surg Am. 2000 Jan;25(1):138-43. doi: 10.1053/jhsu.2000.jhsu025a0138. J Hand Surg Am. 2000. PMID: 10642484
-
Muscle excursion does not correlate with increased serial sarcomere number after muscle adaptation to stretched tendon transfer.J Orthop Res. 2012 Nov;30(11):1774-80. doi: 10.1002/jor.22137. Epub 2012 Apr 24. J Orthop Res. 2012. PMID: 22532301 Free PMC article.
-
Adaptation of physiological cross-sectional area and serial number of sarcomeres after tendon transfer of rat muscle.Scand J Med Sci Sports. 2016 Mar;26(3):244-55. doi: 10.1111/sms.12431. Epub 2015 Feb 18. Scand J Med Sci Sports. 2016. PMID: 25693427
-
Tendon transfer surgery: clinical implications of experimental studies.Clin Orthop Relat Res. 2002 Oct;(403 Suppl):S163-70. Clin Orthop Relat Res. 2002. PMID: 12394465 Review.
-
Biomechanics of Tendon Transfers.Hand Clin. 2016 Aug;32(3):291-302. doi: 10.1016/j.hcl.2016.03.011. Epub 2016 Jun 3. Hand Clin. 2016. PMID: 27387073 Review.
Cited by
-
Surgical repair of the supraspinatus: pre- and postoperative architectural changes in the muscle.Singapore Med J. 2022 Feb;63(2):97-104. doi: 10.11622/smedj.2020123. Epub 2020 Aug 17. Singapore Med J. 2022. PMID: 32798361 Free PMC article.
-
Obtaining Quality Extended Field-of-View Ultrasound Images of Skeletal Muscle to Measure Muscle Fascicle Length.J Vis Exp. 2020 Dec 14;(166):10.3791/61765. doi: 10.3791/61765. J Vis Exp. 2020. PMID: 33369599 Free PMC article.
-
Cellular mechanisms of tissue fibrosis. 4. Structural and functional consequences of skeletal muscle fibrosis.Am J Physiol Cell Physiol. 2013 Aug 1;305(3):C241-52. doi: 10.1152/ajpcell.00173.2013. Epub 2013 Jun 12. Am J Physiol Cell Physiol. 2013. PMID: 23761627 Free PMC article. Review.
-
Passive skeletal muscle excursion after tendon rupture correlates with increased collagen content in muscle.Yonsei Med J. 2014 Sep;55(5):1395-9. doi: 10.3349/ymj.2014.55.5.1395. Yonsei Med J. 2014. PMID: 25048502 Free PMC article.
-
High resolution muscle measurements provide insights into equinus contractures in patients with cerebral palsy.J Orthop Res. 2015 Jan;33(1):33-9. doi: 10.1002/jor.22728. Epub 2014 Sep 19. J Orthop Res. 2015. PMID: 25242618 Free PMC article.
References
-
- Tabary JC, Tardieu C, Tardieu G, Tabary C, Gagnard L. Functional adaptation of sarcomere number of normal cat muscle. J Physiol (Paris). 1976;72:277-91 - PubMed
Publication types
MeSH terms
Substances
Grants and funding
LinkOut - more resources
Full Text Sources
Molecular Biology Databases
Research Materials

