. 2010 Mar 1;24(5):478-90.
doi: 10.1101/gad.1856210.

miR-125b-2 is a potential oncomiR on human chromosome 21 in megakaryoblastic leukemia

Affiliations

miR-125b-2 is a potential oncomiR on human chromosome 21 in megakaryoblastic leukemia

Jan-Henning Klusmann et al. Genes Dev. .

Abstract

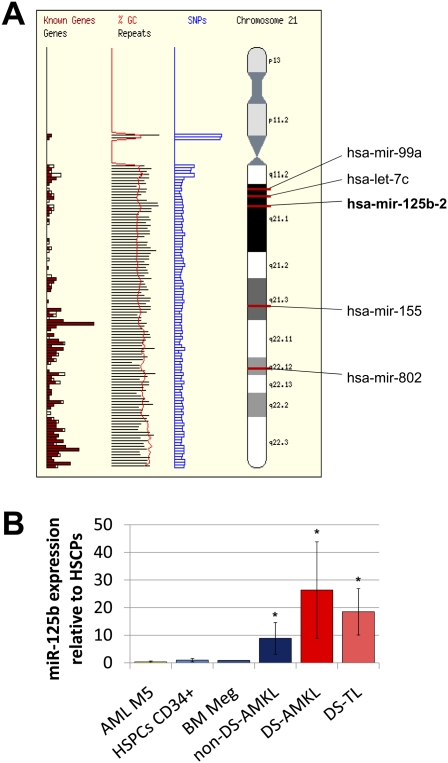
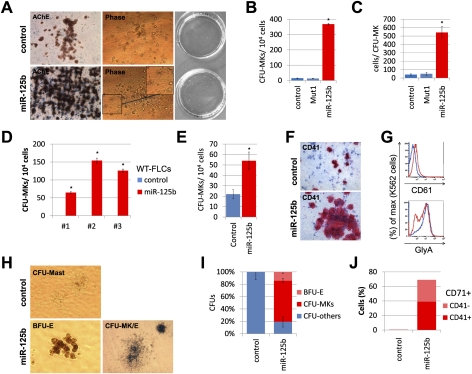
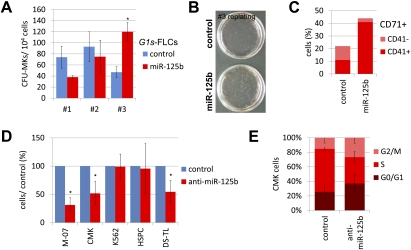
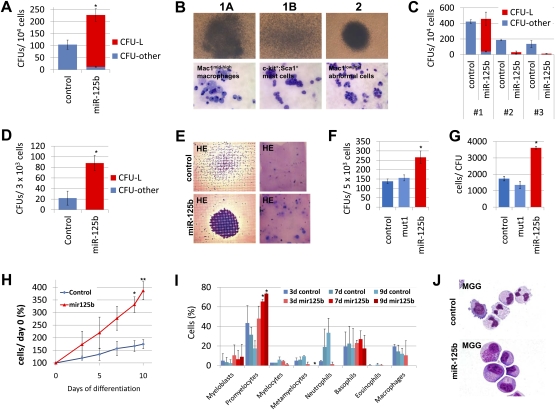
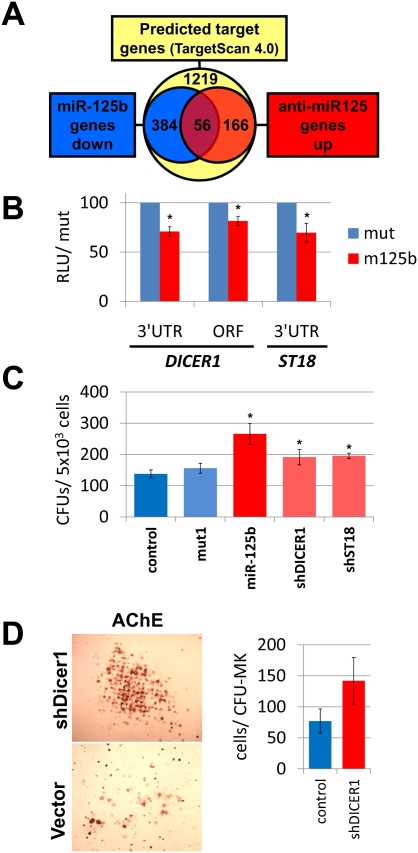
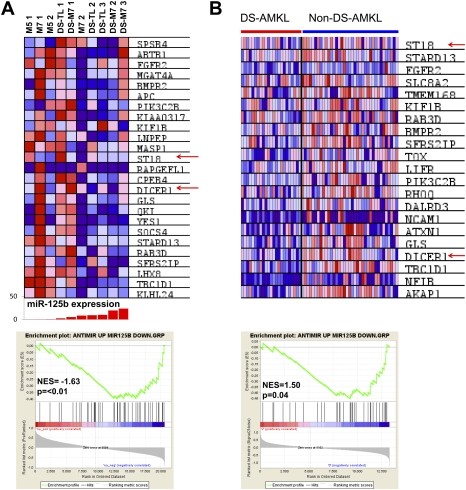
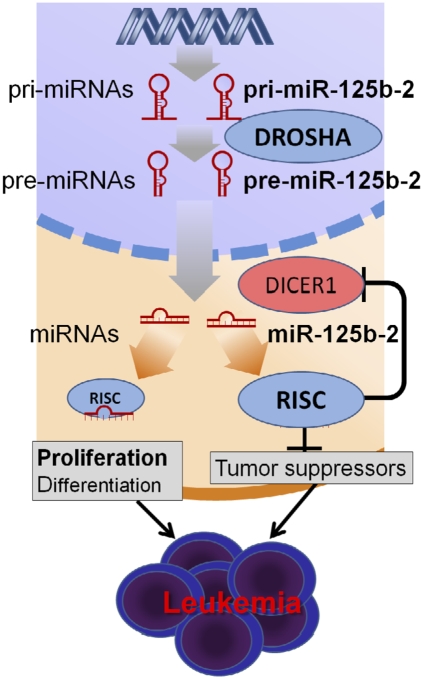
Children with trisomy 21/Down syndrome (DS) are at high risk to develop acute megakaryoblastic leukemia (DS-AMKL) and the related transient leukemia (DS-TL). The factors on human chromosome 21 (Hsa21) that confer this predisposing effect, especially in synergy with consistently mutated transcription factor GATA1 (GATA1s), remain poorly understood. Here, we investigated the role of Hsa21-encoded miR-125b-2, a microRNA (miRNA) overexpressed in DS-AMKL/TL, in hematopoiesis and leukemogenesis. We identified a function of miR-125b-2 in increasing proliferation and self-renewal of human and mouse megakaryocytic progenitors (MPs) and megakaryocytic/erythroid progenitors (MEPs). miR-125b-2 overexpression did not affect megakaryocytic and erythroid differentiation, but severely perturbed myeloid differentiation. The proproliferative effect of miR-125b-2 on MEPs accentuated the Gata1s mutation, whereas growth of DS-AMKL/TL cells was impaired upon miR-125b repression, suggesting synergism during leukemic transformation in GATA1s-mutated DS-AMKL/TL. Integrative transcriptome analysis of hematopoietic cells upon modulation of miR-125b expression levels uncovered a set of miR-125b target genes, including DICER1 and ST18 as direct targets. Gene Set Enrichment Analysis revealed that this target gene set is down-regulated in DS-AMKL patients highly expressing miR-125b. Thus, we propose miR-125b-2 as a positive regulator of megakaryopoiesis and an oncomiR involved in the pathogenesis of trisomy 21-associated megakaryoblastic leukemia.


Figures

Figure 1.
Figure 1.
Hsa21-encoded miR-125b is up-regulated in AMKL patient samples. (A) Schematic diagram showing the location of miR-125b-2 and four other miRNAs (miR-99a, let-7c, miR-155, and miR-802) on human Hsa21 (http://www.ensembl.org). (B) The expression level of miR-125b was analyzed by qRT–PCR in sorted leukemic blasts from patients with DS-AMKL (n = 5), DS-TL (n = 4), non-DS-AMKL (n = 3), and AML FAB M5 (AML M5; n = 2), and in CD34+-HSPCs (n = 2) and megakaryocytes (BM-Meg; n = 1) from healthy donors. Data are presented as means ± standard error of the mean (SEM) normalized to CD34+-HSPCs. (*) PU-Test < 0.05.
Figure 2.
Figure 2.
miR-125b-2 overexpression induced proliferation and differentiation of MPs and MEPs. (A) Microscopic (left, middle) and macroscopic (right) images of AChE-stained and unstained (Phase) CFU-MKs from miR-125b-2-transduced and empty vector-transduced (LMPIG or MSCV-puro) murine FL cells. The inset of the bottom middle panel shows proplatelet formation. Pictures here are representative images from n = 3 independent experiments. (B,C) Megakaryocytic colony-forming assay of miR-125b-2-transduced, mutated miR-125b-2-transduced (mut1), and empty vector-transduced (LMPIG; control) wild-type FL MPs using methocellulose-based assays in the presence of 20 ng/mL TPO. (B) Diagram and statistics showing the number of CFU-MKs per 104 plated cells. Data of replicates from one of two independent experiments are shown as means ± SD. (*) P < 0.05. (C) Diagram and statistics showing the number of cells per CFU-MK. Data from replicates from one representative experiment are shown as means ± SD. (*) P < 0.05. (D) Diagram and statistics showing the number of CFU-MKs (per 104 plated cells) in serial replating of miR-125b-2-transduced and empty vector-transduced (LMPIG; control) wild-type FL progenitors using methocellulose-based assays. Data from replicates from one of two independent experiments are shown as means ± SD. (*) P < 0.05. (E) Diagram and statistics showing the number of CFU-MKs per 104 miR-125b-2-transduced and empty vector-transduced (MIGR1; control) human CD34+-HSPCs. Data from n = 2 independent experiments are shown as means ± SD. (*) P < 0.05. (F) Representative images of immunohistochemically stained (CD41) and hematoxylin and eosin-stained (HE) colony-forming assays as shown in E. (G) CD61 and GlyA expression in miR-125b-2-transduced and empty vector-transduced K562 cells. The representative FACS profiles from one of two independent experiments are shown. (Blue line) Empty vector (LMPIG; control); (red line) miR-125b-2. (H) Representative microscopic images showing unstained (Phase) CFUs (CFU-Mast, BFU-E, and CFU-MK/E) from miR-125b-2-transduced and empty vector-transduced (MSCV-puro; control) murine wild-type FL cells from the third replating using methocellulose-based assays in the presence of TPO, SCF, EPO, IL-3, and IL-6. (I,J) Diagrams showing the relative distribution of CFUs (I) and the percentages of CD71+CD41 and CD71+CD41+ cells (J) as assessed by flow cytometry in the third replating of miR-125b-2-transduced and empty vector-transduced (MSCV-puro) murine wild-type FL cells as shown in H.
Figure 3.
Figure 3.
miR-125b-2 overexpression synergizes with Gata1s mutation, whereas miR-125b repression inhibits DS megakaryocytic leukemia cell growth. (A) Diagram and statistics showing the number of CFU-MKs (per 104 plated cells) in serial replating of miR-125b-2-transduced and empty vector-transduced (MSCV-puro; control) Gata1s FL cells (G1s-FLCs) using methocellulose-based assays in the presence of TPO, SCF, EPO, IL-3, and IL-6. Data from replicates in one representative experiment are presented as means ± SD. (*) P < 0.05. (B) Macroscopic images of the colony-forming assays from the third replating as shown in A and C. (C) Flow cytometric analysis of the third replating of miR-125b-2-transduced and empty vector-transduced (control) murine Gata1s FL cells. The diagram shows percentages of CD71+CD41 and CD71+CD41+ cells. (D) Cell counts of M-07 (n = 4), CMK (n = 4), and K562 cell lines (n = 4), as well as CD34+-HSPCs (n = 3) and primary DS-TL blasts (n = 3) 48 h after transfection with anti-miR-125b, in relation to the nonsilencing oligonucleotide-transfected cells as a control. Data from independent experiments are shown as means ± SD. (*) P < 0.05. (E) Cell cycle analysis using 7-AAD and BrdU of CMK cells 48 h after transfection with anti-miR-125b or nonsilencing oligonucleotides. The diagram shows the percentage of cells in G0/G1, S, and G2/M phase. Data from n = 2 independent experiments are shown as means ± SD.
Figure 4.
Figure 4.
Overexpression of miR-125b-2 perturbs myeloid differentiation of HSPCs. (A) Number of CFUs per 104 plated miR-125b-2-transduced and empty vector-transduced (LMPIG) murine BM cells. Data of replicates from one of three independent experiments are presented as means ± SD. (*) P < 0.05. (B) Microscopic images of colony-forming assays show representative CFUs from one of n = 3 independent experiments of miR-125b-2-transduced murine BM cells. The bottom panel shows May-Grünwald-Giemsa (MGG)-stained cytospins and the immunophenotype of the respective colonies. Type 1A CFUs contained Mac-1high macrophages and type 1B CFUs contained mast cells (CFU-others). Type 2 CFUs contained a mixture of granulocytes, macrophages, and immature myeloblasts (CFU-L). (C) Diagram showing the number of CFUs (per 104 plated cells) in serial replating of miR-125b-2-transduced and empty vector-transduced (MSCV-puro; control) BM cells using methocellulose-based assays. Error bars represent means ± SD of replicates in one representative experiment. (D) Number of CFUs per 3 × 10³ plated miR-125b-2-transduced and empty vector-transduced (MIGR1; control) human CD34+-HSPCs using collagen-based colony-forming assays. Data from n = 3 independent experiments are shown as means ± SD. (*) P < 0.05. (E) Representative images of hematoxylin and eosin (HE)-stained colony-forming assays from miR-125b-2-transduced and empty vector-transduced (MIGR1; control) human CD34+-HSPCs as shown in D. The left panel shows microscopic images and the right panel shows the colony-forming assay without magnification. (F,G) Colony-forming assays of miR-125b-2-transduced, mutated miR-125b-2-transduced (mut1), and empty vector-transduced (LMPIG; control) human CD34+-HSPCs using methocellulose-based assays. (F) Diagram and statistics showing the number of CFUs per 5 × 10³ plated cells. (G) Diagram and statistics showing the number of cells per CFU. Replicates from one representative experiment are shown as means ± SD. (*) P < 0.05. (H–J) Cell counts (in relation to day 0; =100%) (H), differential WBC counts (I), and May-Grünwald-Giemsa-stained cytospins (day 9) (J) of miR-125b-2-transduced and empty vector-transduced (control) human CD34+-HSPCs cultured in granulocytic differentiation medium. Data from n = 3 (H) and n = 2 (I) independent experiments are shown as means ± SD. (*) P < 0.05; (**) P < 0.01.
Figure 5.
Figure 5.
Integrative bioinformatic analysis identified miR-125b target genes in hematopoietic cells. (A) Venn-diagram showing the number of probes (Affymetrix HG U133 plus 2.0) for genes predicted as target genes by TargetScan 4.1, up-regulated >1.2-fold upon transfection of anti-miR-125b in M-07 (n = 2) and CMK (n = 2) cells in comparison with the nonsilencing control (n = 2, respectively), and down-regulated >1.2-fold upon transduction of HSPCs with miR-125b-2 in comparison with empty vector-transduced control cells (MIGR1). (B) Dual -uciferase reporter assay of HEK293T cells cotransfected with Luc-DICER1-ORF, Luc-DICER1-3′UTR, or Luc-ST18-3′UTR, together with MIGR1-miR-125b-2 or MIGR1-mut. Relative light units (RLUs) are presented as means ± SD of n = 3 independent experiments in relation to the control (=100%). (*) P < 0.05. (C) Number of CFUs per 5 × 10³ plated miR-125b-2-transduced, mutated miR-125b-2-transduced, shST18-transduced, shDICER1-transduced, and empty vector-transduced (LMPIG; control) human CD34+-HSPCs. Replicates from one representative experiment are shown as means ± SD. (*) P < 0.05. (D) Colony-forming assays of shDICER1-transduced and empty vector-transduced (LMPIG; control) murine FL cells. (Left) Microscopic AChE-stained images showing representative CFUs. (Right) Diagram showing the number of AChE-positive cells per CFU. Cell counts of five randomly picked colonies from one of three independent experiments are shown as means ± SD.
Figure 6.
Figure 6.
miR-125b target genes are down-regulated in DS-AMKL. (A) GSEA of the identified miR-125b target gene set in leukemic blasts from patients with DS-AMKL (DS-M7, n = 3), DS-TL (n = 3), non-DS-AMKL (M7, n = 2), and AML FAB M5 (M5, n = 2). Pearson's correlation was used to determine the degree of linear relationship between miR-125b expression and the expression of the identified miR-125b target gene set. (Top) Heat map of the leading-edge subset including DICER1 and ST18 (arrows), with the miR-125b expression below. Samples are ordered according to their miR-125b expression. Normalized enrichment score (NES) = −1.63; false discovery rate (FDR) q = 0.007; P = 0.007. (B) GSEA of the identified miR-125b target gene set in leukemic blasts from patients with DS-AMKL (DS-M7, n = 23) and non-DS-AMKL (M7, n = 37) from a previously published data set (Bourquin et al. 2006). (Top) Heat map of the leading-edge subset including DICER1 and ST18 (arrows). (Bottom) Enrichment plot and statistics. NES = −1.50; FDR q = 0.042; P = 0.042.
Figure 7.
Figure 7.
Proposed model for the role of Hsa21-encoded miR-125b-2 in leukemogenesis. DICER1 and miR-125b-2 form a regulatory negative feedback loop. Production of mature miR-125b-2 by DICER1 results in repression of DICER1 expression levels and, subsequently, impaired overall miRNA processing. This miRNA-mediated mechanism for low DICER1 expression levels leads to a failure to express mature miRNAs essential for terminal hematopoietic differentiation. These pro-oncogenic effects of miR-125b-2 can be enhanced further by the repression of tumor suppressors such as ST18.

Similar articles

Cited by

References

    1. Bourquin JP, Subramanian A, Langebrake C, Reinhardt D, Bernard O, Ballerini P, Baruchel A, Cave H, Dastugue N, Hasle H, et al. Identification of distinct molecular phenotypes in acute megakaryoblastic leukemia by gene expression profiling. Proc Natl Acad Sci. 2006;103:3339–3344. - PMC - PubMed
    1. Bousquet M, Quelen C, Rosati R, Mansat-De Mas V, La Starza R, Bastard C, Lippert E, Talmant P, Lafage-Pochitaloff M, Leroux D, et al. Myeloid cell differentiation arrest by miR-125b-1 in myelodysplastic syndrome and acute myeloid leukemia with the t(2;11)(p21;q23) translocation. J Exp Med. 2008;205:2499–2506. - PMC - PubMed
    1. Carthew RW, Sontheimer EJ. Origins and mechanisms of miRNAs and siRNAs. Cell. 2009;136:642–655. - PMC - PubMed
    1. Chen CZ, Li L, Lodish HF, Bartel DP. MicroRNAs modulate hematopoietic lineage differentiation. Science. 2004;303:83–86. - PubMed
    1. Chou ST, Opalinska JB, Yao Y, Fernandes MA, Kalota A, Brooks JS, Choi JK, Gewirtz AM, Danet-Desnoyers GA, Nemiroff RL, et al. Trisomy 21 enhances human fetal erythro-megakaryocytic development. Blood. 2008;112:4503–4506. - PMC - PubMed

Publication types

MeSH terms