

Salmonella enterica serovar Typhimurium-induced placental inflammation and not bacterial burden correlates with pathology and fatal maternal disease
- PMID: 20194592
- PMCID: PMC2863547
- DOI: 10.1128/IAI.01186-09
Salmonella enterica serovar Typhimurium-induced placental inflammation and not bacterial burden correlates with pathology and fatal maternal disease
Abstract
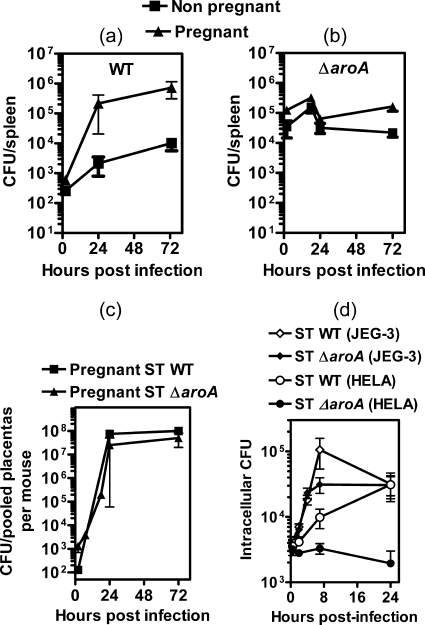
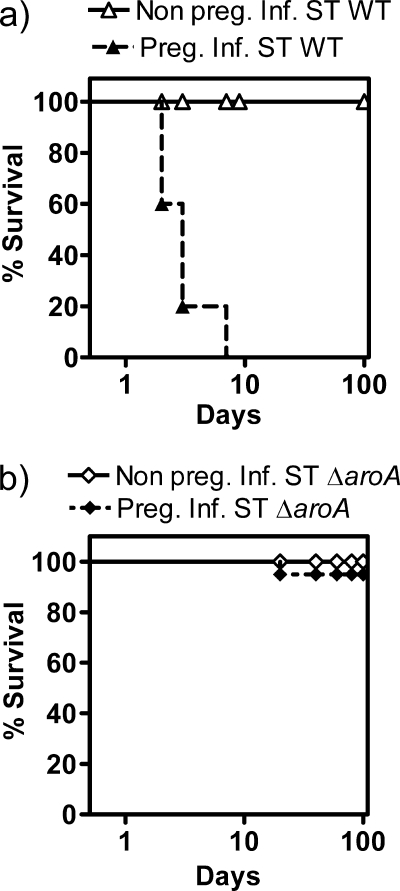
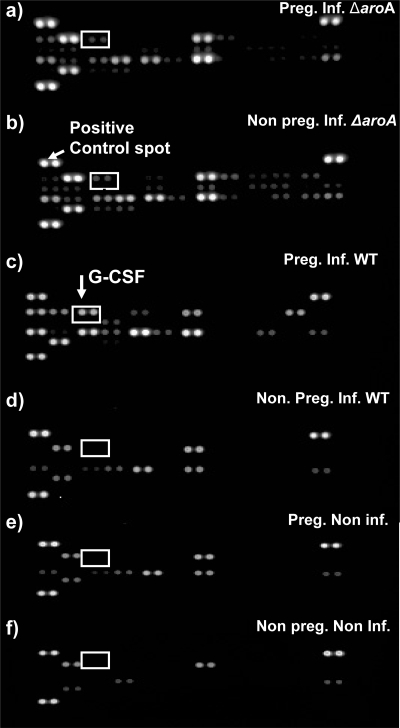
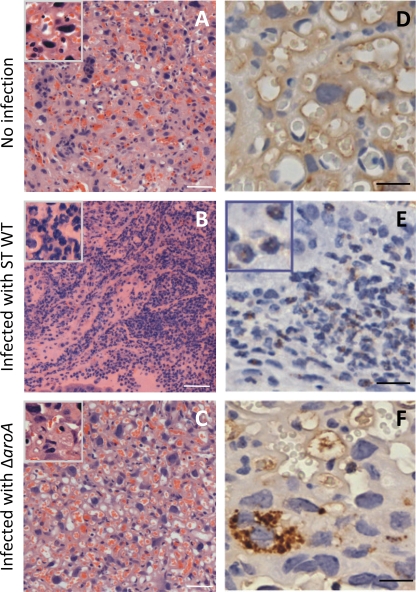
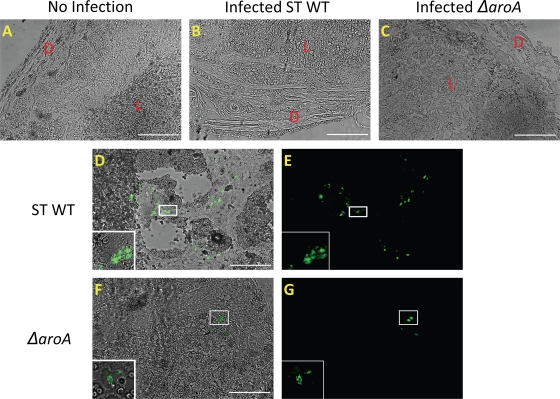
Food-borne infections caused by Salmonella enterica species are increasing globally, and pregnancy poses a high risk. Pregnant mice rapidly succumb to S. enterica serovar Typhimurium infection. To determine the mechanisms involved, we addressed the role of inflammation and bacterial burden in causing placental and systemic disease. In vitro, choriocarcinoma cells were a highly conducive niche for intracellular S. Typhimurium proliferation. While infection of mice with S. Typhimurium wild-type (WT) and mutant (Delta aroA and Delta invA) strains led to profound pathogen proliferation and massive burden within placental cells, only the virulent WT S. Typhimurium infection evoked total fetal loss and adverse host outcome. This correlated with substantial placental expression of granulocyte colony-stimulating factor (G-CSF), interleukin-6 (IL-6), and tumor necrosis factor alpha (TNF-alpha) and increased serum inflammatory cytokines/chemokines, such as G-CSF, IL-6, CCL1, and KC, evoked by WT S. Typhimurium infection. In contrast, infection with high doses of S. Typhimurium Delta aroA, despite causing massive placental infection, resulted in reduced inflammatory cellular and cytokine response. While S. Typhimurium WT bacteria were dispersed in large numbers across all regions of the placenta, including the deeper labyrinth trophoblast, S. Typhimurium Delta aroA bacteria localized primarily to the decidua. This correlated with the widespread placental necrosis accompanied by neutrophil infiltration evoked by the S. Typhimurium WT bacteria. Thus, the ability of Salmonella to localize to deeper layers of the placenta and the nature of inflammation triggered by the pathogen, rather than bacterial burden, profoundly influenced placental integrity and host survival.
Figures


Comment in
-
Murine fetoplacental infection models.Infect Immun. 2010 Nov;78(11):4965; author reply 4965-6. doi: 10.1128/IAI.00641-10. Infect Immun. 2010. PMID: 20956576 Free PMC article. No abstract available.
Similar articles
-
IFN-alpha receptor deficiency enhances host resistance to oral Salmonella enterica serovar Typhimurium infection during murine pregnancy.Am J Reprod Immunol. 2021 Oct;86(4):e13454. doi: 10.1111/aji.13454. Epub 2021 May 29. Am J Reprod Immunol. 2021. PMID: 33991140
-
Roles of natural resistance-associated macrophage protein-1 in modulating bacterial distribution and immune responses during Salmonella enterica serovar Typhimurium infection in murine pregnancy.Am J Reprod Immunol. 2022 Oct;88(4):e13599. doi: 10.1111/aji.13599. Epub 2022 Aug 23. Am J Reprod Immunol. 2022. PMID: 35851978 Free PMC article.
-
Analysis of the capacity of Salmonella enterica Typhimurium to infect the human Placenta.Placenta. 2019 Aug;83:43-52. doi: 10.1016/j.placenta.2019.06.386. Epub 2019 Jun 26. Placenta. 2019. PMID: 31477206 Free PMC article.
-
Net replication of Salmonella enterica serovars Typhimurium and Choleraesuis in porcine intestinal mucosa and nodes is associated with their differential virulence.Infect Immun. 2007 Aug;75(8):3950-60. doi: 10.1128/IAI.00366-07. Epub 2007 Jun 4. Infect Immun. 2007. PMID: 17548482 Free PMC article.
-
Limited role for ASC and NLRP3 during in vivo Salmonella Typhimurium infection.BMC Immunol. 2014 Aug 13;15:30. doi: 10.1186/s12865-014-0030-7. BMC Immunol. 2014. PMID: 25115174 Free PMC article.
Cited by
-
Pathogens and the placental fortress.Curr Opin Microbiol. 2012 Feb;15(1):36-43. doi: 10.1016/j.mib.2011.11.006. Epub 2011 Dec 12. Curr Opin Microbiol. 2012. PMID: 22169833 Free PMC article. Review.
-
Yellow Fever Vaccination in a Mouse Model Is Associated With Uninterrupted Pregnancies and Viable Neonates Except When Administered at Implantation Period.Front Microbiol. 2020 Feb 20;11:245. doi: 10.3389/fmicb.2020.00245. eCollection 2020. Front Microbiol. 2020. PMID: 32153534 Free PMC article.
-
Immunobiology of Acute Chorioamnionitis.Front Immunol. 2020 Apr 16;11:649. doi: 10.3389/fimmu.2020.00649. eCollection 2020. Front Immunol. 2020. PMID: 32373122 Free PMC article. Review.
-
Salmonella Typhi-Exposed Placentae: Chorionic Villi Histomorphology and Neonatal Birthweight.Diseases. 2025 Jun 30;13(7):205. doi: 10.3390/diseases13070205. Diseases. 2025. PMID: 40709995 Free PMC article.
-
Brucella abortus Proliferates in Decidualized and Non-Decidualized Human Endometrial Cells Inducing a Proinflammatory Response.Pathogens. 2020 May 12;9(5):369. doi: 10.3390/pathogens9050369. Pathogens. 2020. PMID: 32408491 Free PMC article.
References
-
- Barragan, A., and L. D. Sibley. 2003. Migration of Toxoplasma gondii across biological barriers. Trends Microbiol. 11:426-430. - PubMed
-
- Beeson, J. G., and P. E. Duffy. 2005. The immunology and pathogenesis of malaria during pregnancy. Curr. Top. Microbiol. Immunol. 297:187-227. - PubMed
-
- Chaouat, G., E. Menu, D. A. Clark, M. Dy, M. Minkowski, and T. G. Wegmann. 1990. Control of fetal survival in CBA x DBA/2 mice by lymphokine therapy. J. Reprod. Fertil. 89:447-458. - PubMed
Publication types
MeSH terms
Substances
Grants and funding
LinkOut - more resources
Full Text Sources
Medical
