. 2010 Mar 15;207(3):491-503.
doi: 10.1084/jem.20091846. Epub 2010 Mar 1.

Resistance to antiangiogenic therapy is directed by vascular phenotype, vessel stabilization, and maturation in malignant melanoma

Affiliations

Resistance to antiangiogenic therapy is directed by vascular phenotype, vessel stabilization, and maturation in malignant melanoma

Iris Helfrich et al. J Exp Med. .

Erratum in

  • J Exp Med. 2013 Apr 8;210(4):853. Augustin, Helmut G [added]

Abstract

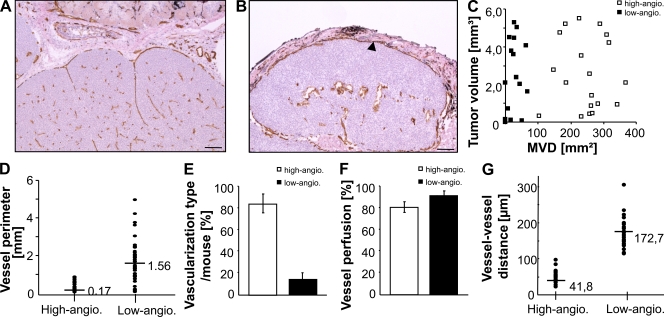
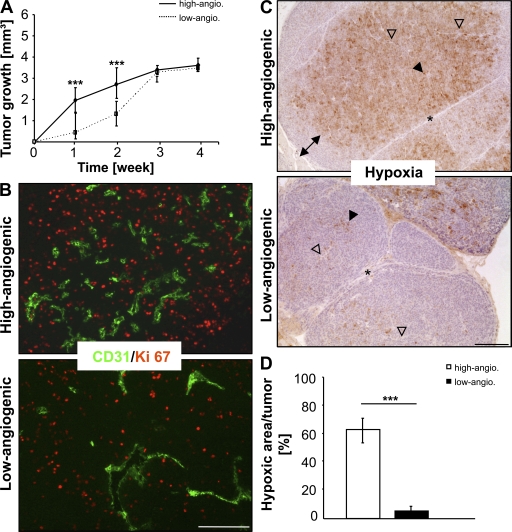
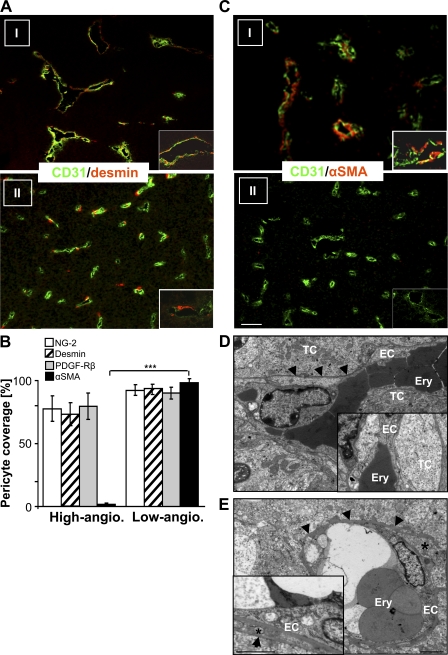
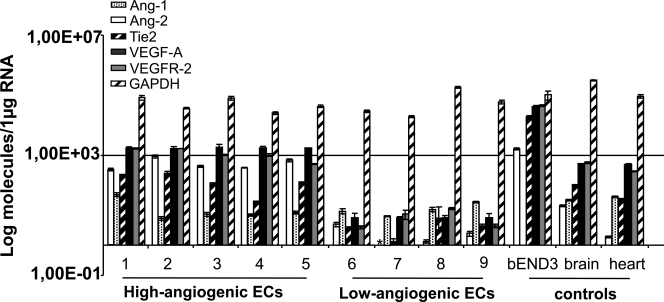
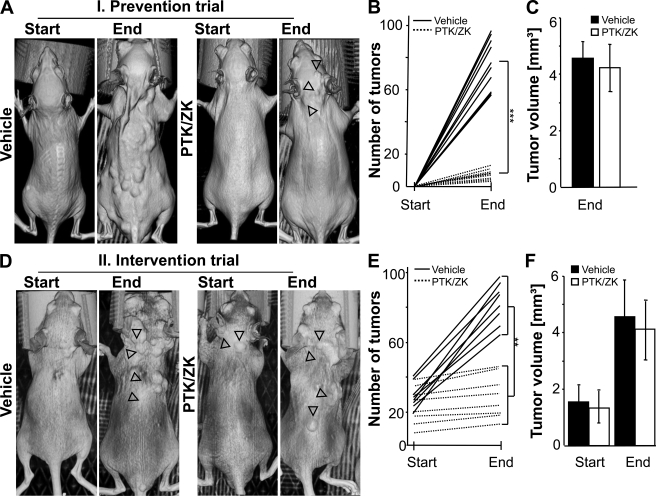
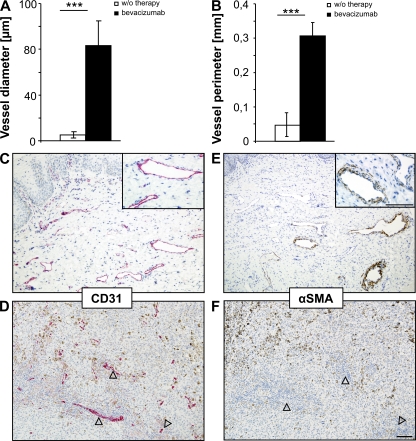
Angiogenesis is not only dependent on endothelial cell invasion and proliferation, it also requires pericyte coverage of vascular sprouts for stabilization of vascular walls. Clinical efficacy of angiogenesis inhibitors targeting the vascular endothelial growth factor (VEGF) signaling pathway is still limited to date. We hypothesized that the level of vessel maturation is critically involved in the response to antiangiogenic therapies. To test this hypothesis, we evaluated the vascular network in spontaneously developing melanomas of MT/ret transgenic mice after using PTK787/ZK222584 for anti-VEGF therapy but also analyzed human melanoma metastases taken at clinical relapse in patients undergoing adjuvant treatment using bevacizumab. Both experimental settings showed that tumor vessels, which are resistant to anti-VEGF therapy, are characterized by enhanced vessel diameter and normalization of the vascular bed by coverage of mature pericytes and immunoreactivity for desmin, NG-2, platelet-derived growth factor receptor beta, and the late-stage maturity marker alpha smooth muscle actin. Our findings emphasize that the level of mural cell differentiation and stabilization of the vascular wall significantly contribute to the response toward antiangiogenic therapy in melanoma. This study may be useful in paving the way toward a more rational development of second generation antiangiogenic combination therapies and in providing, for the first time, a murine model to study this.


Figures

Figure 1.
Figure 1.
Immunohistological and morphometric analyses of the vascular network in melanoma of MT/ret transgenic mice. (A and B) Representative images for immunoperoxidase detection of blood vessels using the endothelial marker CD31 in melanoma of high angiogenic (A) and low angiogenic (B) potential (n = 478 tumors of 63 mice, independently performed). Arrowheads indicate peritumoral coverage of endothelial cells in low angiogenic tumors. (C) Scatter blot for MVD (in millimeters squared) versus tumor volume (in millimeters cubed) in high and low angiogenic tumors (n = 20 tumors/vascular bed of four mice). (D) Quantification of vessel perimeter (in millimeters) for both vascular beds of MT/ret transgenic melanoma (n = 500 intratumoral vessels [100 vessels/tumor] of five high angiogenic and 100 intratumoral vessels of nine low angiogenic tumors isolated from two mice). (E) Immunohistochemically based distribution analyses for the incidence of high and low angiogenic-active tumors per mouse (in percentage) calculated after isolation of all tumors (n = 478 tumors of five mice). (F) Perfusion analysis (in percentage) of intratumoral vessels was performed after injection of FITC-conjugated lectin into tumor-bearing mice. Analyzing the number of double-positive lectin- and CD31-positive tumor vessels in comparison with CD31 single-stained vessels resulted in calculation of vessel perfusion (n = 100 vessels/vascular phenotype in 10 tumors each of four mice). Injection experiments were independently performed in each mouse. (G) Analysis of vessel–vessel distances (in micrometers) in both vascular beds of MT/ret-transgenic melanoma (n = 500 intratumoral vessels [100 vessels/tumor] of five high angiogenic and 100 intratumoral vessels of nine low angiogenic tumors of two mice). Median values of the experimental groups are indicated by the horizontal lines (D and G). All morphometric analyzes were microscopically quantified using CD31-stained tissue sections. Error bars, mean ± SD. Bars, 50 µm.
Figure 2.
Figure 2.
Comparative analysis of tumor growth rate, tumor cell proliferation, and induction of hypoxia in MT/ret transgenic mice. (A) Tumor growth curve of high and low angiogenic-active melanoma. Tumor volume (in millimeters cubed) of individual nodules was measured weekly over a period of 4 wk in mice of concordant sex and age using fl-VCT (n = 10 tumors/mouse). The experiment was independently performed three times using five mice (***, P ≤ 0.001). (B) Immunofluorescence labeling of tumor cell proliferation using double staining of the proliferation marker Ki-67 (red) and the endothelial marker CD31 (green) in tumors of high and low angiogenic potential (n = 15 tumors/vascular phenotype of five mice, analyzed in five separate experiments). (C) Immunohistochemical assessment of hypoxic areas in high and low angiogenic-active tumors using pimonidazole injection (n = 10 tumors/vascular bed of three mice). Filled arrowheads indicate selection of hypoxic tumor cells, empty arrowheads show tumor vessels, the double-headed arrow indicates the hypoxic-free tumor margin, and the star indicates tumor septa. Injection experiments were independently performed three times with the corresponding outcome. (D) Quantification of hypoxic area per tumor (in percentage) in high and low angiogenic-active tumors (n = 10 tumors/vascular bed of three mice) of three independent experiments; ***, P ≤ 0.001. Representative images are presented (B and C). Error bars, mean ± SD. Bars, 100 µm.
Figure 3.
Figure 3.
Quantitative assessment of mural cell maturation and stabilization in MT/ret melanoma. (A and C) Immunohistochemical double staining for the endothelial marker CD31 (green) and the early pericytic marker Desmin (red) in low-vascularized (I) and high-vascularized (II) tumors (A), as well as for the late differentiation marker α-SMA (C; red). Representative images of >10 independently performed experiments are presented (n = 43 high angiogenic and 27 low angiogenic tumors of four mice). (B) Quantification of vessel coverage, calculated as the percentage of NG-2–, Desmin-, PDGFR-β–, or α-SMA–positive cells compared with the number of CD31-positive vessels (n = 1,087 high angiogenic and 352 low angiogenic tumor vessels of 10 tumors of four mice; ***, P ≤ 0.001). Data are collected from >10 independent experiments. (D and E) Electron microscopic evaluation of the vascular wall structure in sections of tumor tissues with high vascular density (two to three blood vessels per microscopic field; D) and low vascular density (one to two blood vessels in three to four microscopic fields; E), analyzed for their construction of a basal laminar, availability of pericytes, and pericyte integration (n = 9 tumors/vascular bed of three mice). Data are representative of three independent experiments. EC, endothelial cell; Ery, erythrocytes within the vessel lumen; TC, tumor cells; star, pericyte; arrowheads, basal lamina. Representative images are presented (A and C–E). Error bars, mean ± SD. Bars: (A and C) 100 µm; (D and E) 2 µm.
Figure 4.
Figure 4.
Logarithmic presentation of quantitative expression analysis of angiogenic factors and corresponding receptors from microdissected endothelial cells of MT/ret melanoma. Laser microdissected intratumoral endothelial cells from cryosections of high and low angiogenic-active MT/ret melanoma were used for the quantitative real-time PCR analysis of angiogenic factors and their corresponding receptors (n = 5 high and 4 low angiogenic tumors of three mice). Total RNA of bEND3 cells and mouse brain and heart was used as a control for angiogenic factor expression. The analyses for each factor were done in triplicate for each experiment. Three independently performed experiments showed corresponding outcomes. Error bars, mean ± SD.
Figure 5.
Figure 5.
Analysis of prevention and therapeutic effects of PTK/ZK on melanoma development and progression in MT/ret transgenic mice. (A) Tumor-free mice of concordant age and sex were used for the prevention trial (n = 10 mice/experimental group). MT/ret transgenic mice, orally treated with PTK/ZK (50 mg/1 kg in 0.9% NaCl) or vehicle (0.9% NaCl) alone, were visualized at the beginning and end of therapy using fl-VCT. Therapy-resistant tumors of the PTK/ZK-treated group are highlighted by empty arrowheads. (B) Quantification of tumor development at the end of the prevention therapy in PTK/ZK-treated (n = 9 mice) and vehicle-treated (n = 10 mice) transgenic mice (***, P ≤ 0.001). (C) Total tumor volume analyses (in millimeters cubed) of vehicle-treated (n = 100 tumors of 10 mice) and PTK/ZK-treated (n = 73 tumors of nine mice) mice, grown during therapy using fl-VCT. Data of the prevention trial (A–C) were analyzed in two independently performed experiments. (D) Assessment of therapeutic effects of PTK/ZK in tumor-bearing mice screened at the beginning and end of therapy by fl-VCT (n = 10 mice/experimental group). Hardly observable tumors are highlighted by empty arrowheads. (E) Investigation of tumor number in vehicle- and PTK/ZK-treated mice at the beginning and at the end of therapy (n = 8 mice/experimental group; **, P ≤ 0.005). (F) Analyses of total tumor volume (in millimeters cubed) during the therapeutic trial using fl-VCT (n = 100 tumors [beginning and end] of four vehicle-treated and five PTK/ZK-treated mice). All data of intervention experiments (D–F) were independently performed twice with corresponding outcomes (n = 5 mice/group). Error bars, mean ± SD.
Figure 6.
Figure 6.
Immunohistological and morphometric analyses of the vascular network in bevacizumab-resistant human melanoma metastases. (A and B) Quantification for vessel diameter (in micrometers; A) or vessel perimeter (in millimeters; B) of all existent tumor-associated blood vessels in melanoma metastases of patients receiving bevacizumab therapy (n = 100 vessels in three metastases of three patients), compared with metastases, isolated from patients without therapy (n = 100 vessels in 10 tumors of 10 patients; ***, P ≤ 0.001). (C and D) Immunohistochemical detection of blood vessels using the endothelial cell marker CD31 (red) in cutaneous bevacizumab-resistant metastases (C) versus melanoma metastases developed off therapy (D). Arrowheads indicate tumor-associated blood vessels for better visualization. (E and F) Analysis of mural cell recruitment using the late stage differentiation marker α-SMA (brown) in therapy-resistant melanoma (E) and cutaneous metastases developed in patients without treatment (F). Arrowheads indicate the blood vessel location of the corresponding tumor section used for CD31 detection (D). Nuclei were counterstained using Hematoxylin. All immunohistochemical analyses (C–F) were done using all available and existent melanoma metastases (n = 3 metastases of three patients) of patients receiving bevacizumab therapy or melanoma metastases (n = 10 metastases of 10 patients) of patients without therapy. Immunohistological detection was performed twice with concordant results. Representative images of analyzed melanoma metastases are presented in C and D. Error bars, mean ± SD. Bars, 100 µm.

Similar articles

Cited by

References

    1. Abramsson A., Lindblom P., Betsholtz C. 2003. Endothelial and nonendothelial sources of PDGF-B regulate pericyte recruitment and influence vascular pattern formation in tumors. J. Clin. Invest. 112:1142–1151 - PMC - PubMed
    1. Andrae J., Gallini R., Betsholtz C. 2008. Role of platelet-derived growth factors in physiology and medicine. Genes Dev. 22:1276–1312 10.1101/gad.1653708 - DOI - PMC - PubMed
    1. Armulik A., Abramsson A., Betsholtz C. 2005. Endothelial/pericyte interactions. Circ. Res. 97:512–523 10.1161/01.RES.0000182903.16652.d7 - DOI - PubMed
    1. Benjamin L.E., Hemo I., Keshet E. 1998. A plasticity window for blood vessel remodelling is defined by pericyte coverage of the preformed endothelial network and is regulated by PDGF-B and VEGF. Development. 125:1591–1598 - PubMed
    1. Bergers G., Song S., Meyer-Morse N., Bergsland E., Hanahan D. 2003. Benefits of targeting both pericytes and endothelial cells in the tumor vasculature with kinase inhibitors. J. Clin. Invest. 111:1287–1295 - PMC - PubMed

Publication types

Substances