. 2010 Mar 8;188(5):735-49.
doi: 10.1083/jcb.200910099. Epub 2010 Mar 1.

Integration of contractile forces during tissue invagination

Affiliations

Integration of contractile forces during tissue invagination

Adam C Martin et al. J Cell Biol. .

Abstract

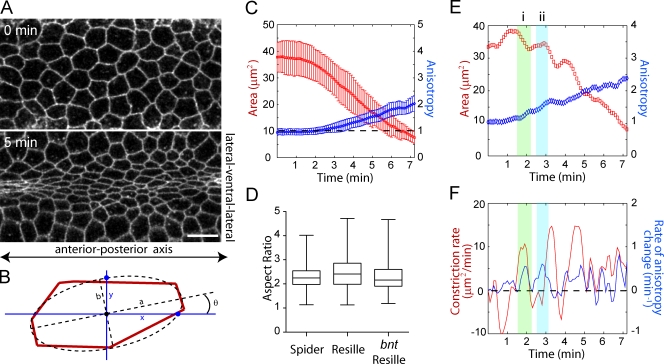
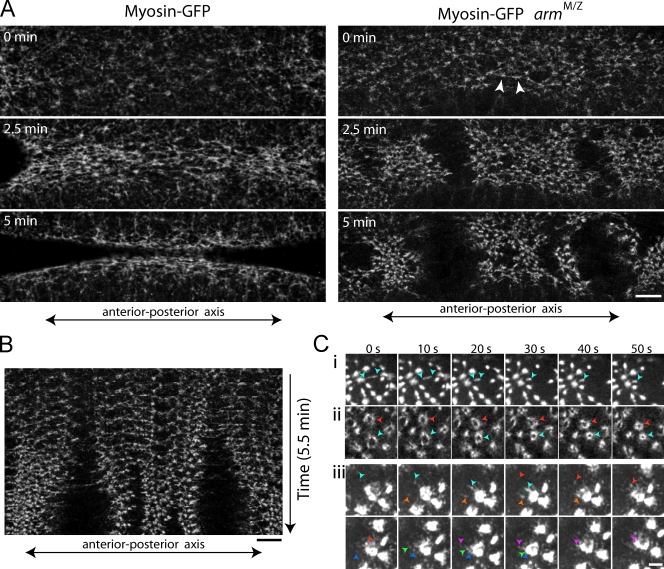
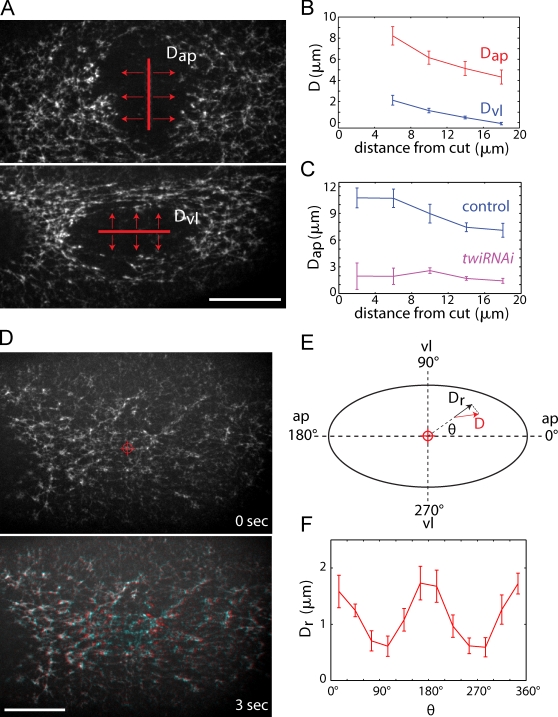
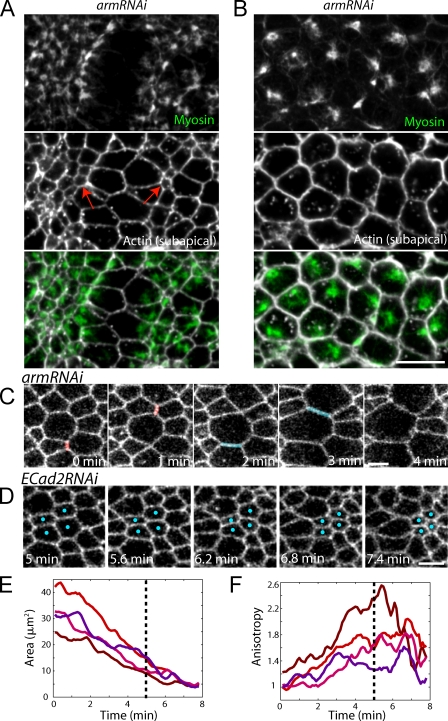
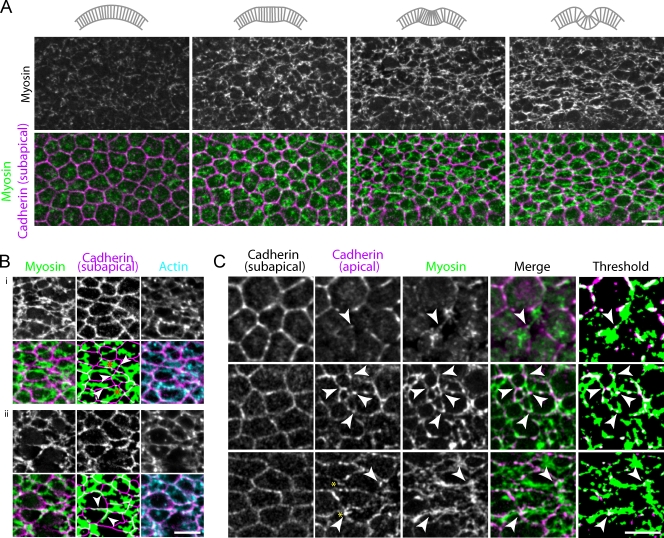
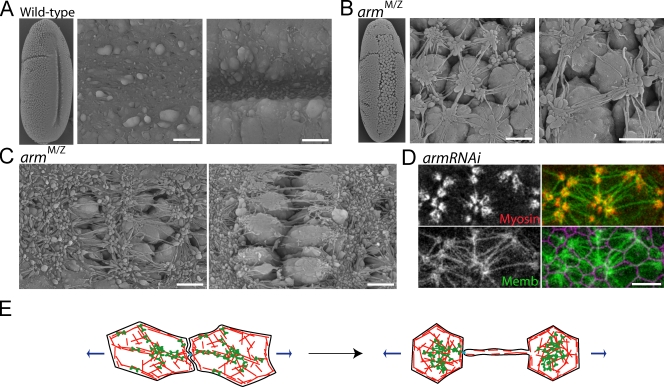
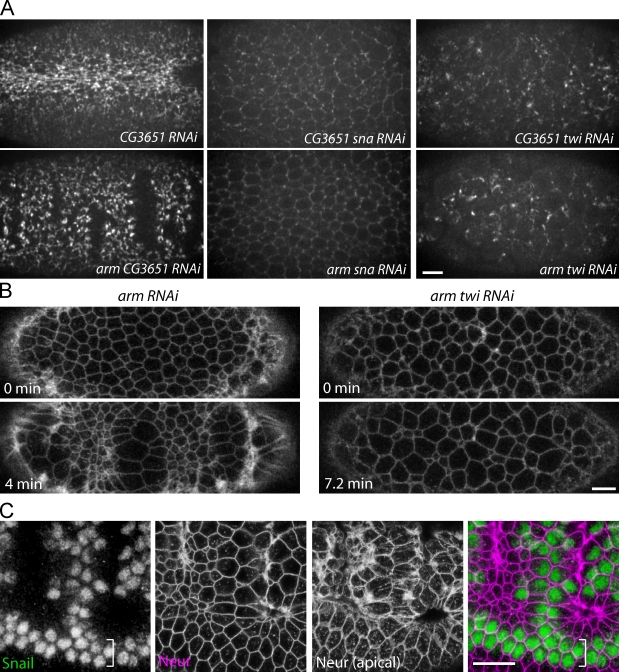
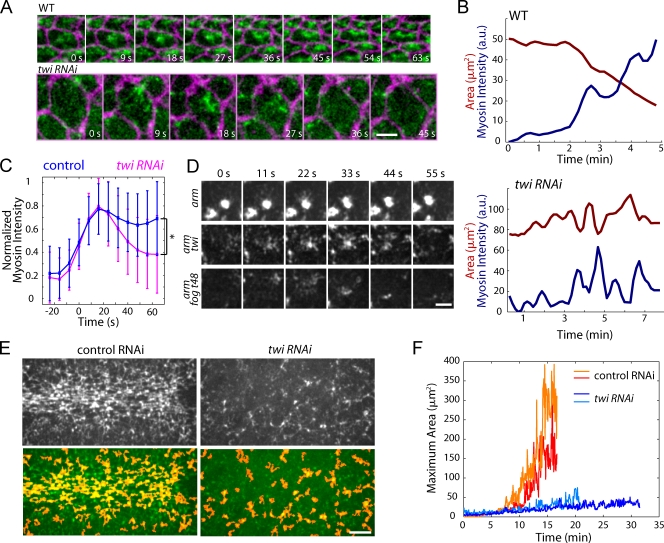
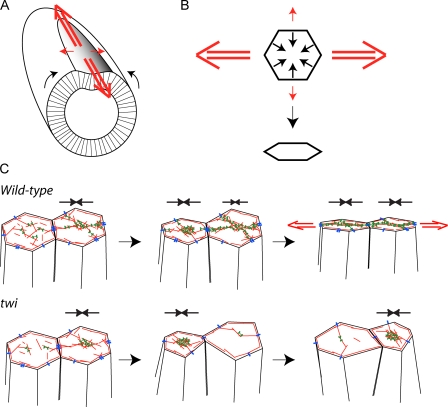
Contractile forces generated by the actomyosin cytoskeleton within individual cells collectively generate tissue-level force during epithelial morphogenesis. During Drosophila mesoderm invagination, pulsed actomyosin meshwork contractions and a ratchet-like stabilization of cell shape drive apical constriction. Here, we investigate how contractile forces are integrated across the tissue. Reducing adherens junction (AJ) levels or ablating actomyosin meshworks causes tissue-wide epithelial tears, which release tension that is predominantly oriented along the anterior-posterior (a-p) embryonic axis. Epithelial tears allow cells normally elongated along the a-p axis to constrict isotropically, which suggests that apical constriction generates anisotropic epithelial tension that feeds back to control cell shape. Epithelial tension requires the transcription factor Twist, which stabilizes apical myosin II, promoting the formation of a supracellular actomyosin meshwork in which radial actomyosin fibers are joined end-to-end at spot AJs. Thus, pulsed actomyosin contractions require a supracellular, tensile meshwork to transmit cellular forces to the tissue level during morphogenesis.


Figures

Figure 1.
Figure 1.
Polarized apical constriction possibly reflects tissue mechanics. (A) Images of ventral furrow cell outlines in a live embryo using Spider-GFP. Bar, 10 µm. (B) Schematic showing the method used to calculate the aspect ratio (a/b) and anisotropy (x/y) of a cell. (C) Mean cross-sectional area (red) and anisotropy (blue) over time for a single embryo. Error bars indicate SD (n = 42 cells). The broken line marks an anisotropy of 1 (isotropic). (D) Box and whisker plot of aspect ratios from Spider-GFP, Resille-GFP, and bicoid nanos torso-like (bnt) Resille-GFP embryos. Boxes extend from to 25th to 75th percentile, with a line at the median. Whiskers extend to the most extreme values. Each sample represents three embryos, with 123, 102, and 158 cells. (E and F) Apical area and anisotropy (E) or constriction rate and the time derivative of anisotropy (F) for an individual cell over time. Anisotropy increases both during (i) and between (ii) contraction pulses. The broken line marks a rate of 0.
Figure 2.
Figure 2.
AJs integrate global epithelial tension. (A) Myosin II in live wild-type or armM/Z embryos. Myosin II initially starts to form a meshwork in armM/Z (arrowheads), but the meshwork separates at discrete positions along the a-p axis. (B) Kymograph of actomyosin meshwork separation in an armM/Z embryo. (C) Tearing of the supracellular meshwork alters myosin II organization and dynamics. Myosin II fibers that normally extend between myosin II spots retract (blue arrows) in armM/Z embryos (i). Loss of cell adhesion in armRNAi embryos causes myosin II to form rings (red and blue arrows) that contract (ii). Contracted myosin II rings in armRNAi embryos exhibit continuous, unrestrained cortical flow of myosin II spots (colored arrows track myosin spots over time) into the ring (iii). Bars: (A) 10 µm; (B) 10 µm; (C) 5 µm.
Figure 3.
Figure 3.
Epithelial tension is highest along the length of the furrow. (A) Myosin-GFP images immediately after laser incisions (red lines, 20 µm) were made perpendicular to (top) or parallel to (bottom) the furrow. Myosin displacements perpendicular to these incisions (Dap and Dvl) were measured. Bar, 20 µm. (B) Dap and Dvl as a function of distance from the laser incision. The data were grouped into 4-µm bins (0–4, 4–8, etc…) and data points are mean ± SEM (indicated by error bars; n = 4 embryos). (C) Dap as a function of distance for H2O-injected (control) and twiRNAi embryos. Data points are the same as in B (n = 5 embryos). (D) Myosin-GFP images before (top) and after (bottom) a point ablation (crosshair). In the bottom panel, the post-ablation image (red) overlays the pre-ablation image (blue) to illustrate myosin displacement. Bar, 20 µm. (E) Schematic illustrating the method used for quantifying radial myosin displacement (Dr) in the direction (θ) relative to the a-p and v-l axes. Radial displacement is the component of the measured displacement (D) along direction θ. (F) Dr as a function of θ. The data were grouped into bins of 30° and data points are mean ± SEM (indicated by error bars; n = 5 embryos).
Figure 4.
Figure 4.
Anisotropic apical constriction results from a-p epithelial tension. (A and B) Apical myosin II (green) and subapical F-actin used to visualize cell outlines (white) in fixed armRNAi embryos. (A) A tear similar to those observed in live embryos. Red arrows indicate cells that have constricted isotropically. (B) A later-staged embryo where myosin II has rounded up into rings. (C) Disruption of AJs results in loss of cell–cell adhesion. Time-lapse images of cell outlines (Spider-GFP) during a tear in an armRNAi embryo. Red cell–cell contacts are lost and different cells come into contact (blue). (D) Isotropic apical constriction occurs upon tearing. Time-lapse images of cell outlines (Spider-GFP) in an E-CadherinRNAi embryo. Blue dots indicate initially anisotropic cells that constrict isotropically upon loss of epithelial integrity. Apical area (E) and anisotropy (F) were quantified for the cells labeled in D. Dotted lines indicates the time of the tear. Bars: (A and B) 10 µm; (C) 5 µm; (D) 5 µm.
Figure 5.
Figure 5.
Spot AJs integrate actomyosin fibers to form a supracellular meshwork. (A) Apical myosin II (green) and subapical E-cadherin, ∼2 µm below the apical cortex (purple), in fixed embryos. Schematics indicating the stage of furrow formation are shown above each image pair. (B) Magnified view of supracellular actomyosin fibers. Apical myosin II (green), subapical E-cadherin (purple), and apical actin filaments (cyan) were imaged in fixed embryos. Supracellular actomyosin fibers are often oriented perpendicular to cell interfaces (i, arrows), but can also be seen running parallel to cell interfaces (ii, arrows). Actomyosin fibers often radiated from a central myosin II spot or ring (red asterisks). The bottom-middle images of i and ii were thresholded to facilitate visualization of myosin II fibers. (C) Apical E-cadherin (purple) and myosin II (green) in fixed embryos. Subapical E-cadherin staining is used to illustrate cell outlines. Myosin II fibers connect to apical E-cadherin puncta, or spot AJs (arrows). In late stages, spot AJs can appear stretched along the fiber (yellow asterisks). Bars, 5 µm.
Figure 6.
Figure 6.
Sensitizing AJs disrupts intracellular connections between the actomyosin cytoskeleton and the plasma membrane. (A) Scanning EM of ventral furrows in wild-type embryos. (B and C) Scanning EM of armM/Z embryos. Membrane tethers extend between dissociated cells (B) and across epithelial tears (C). (D) Myosin II localizes to regions of membrane blebs that are interconnected by membrane tethers. Images of apical myosin II (red, myosin-mCherry), apical membrane (green, Spider-GFP), and subapical membrane (purple) in live armRNAi embryos. (E) Model: Lower adhesion in arm mutants causes higher tension per adhesive structure, leading to the rupture of fiber–AJ connections. Bars: (A–C) 5 µm; (D) 10 µm.
Figure 7.
Figure 7.
Snail and Twist are required for epithelial tearing. (A) Images of myosin-GFP in live embryos injected with the indicated dsRNA. snaRNAi inhibits the formation of myosin II rings and the loss of cell–cell adhesion normally observed in armRNAi embryos. twiRNAi inhibits tearing, but myosin contractions still occur. (B) Images of cell outlines (Spider-GFP) in armRNAi and arm-twiRNAi embryos. Knockdown of Twist suppresses the formation of discrete epithelial tears. (C) Epithelial tears and loss of cell–cell adhesion occur within the Snail expression domain. Images of a fixed armM/Z embryo stained for Snail (green) and neurotactin (purple, cell outlines). An apical image of neurotactin is included to illustrate the position of the tear. The ventral midline is offset to visualize the lateral border of the mesoderm where two Snail-expressing nuclei do not initially lose adhesion (white bracket). Bars, 10 µm.
Figure 8.
Figure 8.
Twist is required for myosin II stabilization and supracellular meshwork formation. (A) Twist is required to stabilize apical myosin II fibers after contraction. Time-lapse images of myosin-GFP (green) and membrane-mCherry (purple). Bar, 5 µm. (B) Quantification of apical area (red) and myosin intensity (blue) in individual cells from wild-type and twiRNAi embryos. (C) Twist is required to maintain cortical myosin II after a contraction pulse. Normalized myosin intensity for individual contraction pulses was averaged. Data are means ± SD, which is indicated by the error bars (control: n = 329 pulses, 120 cells, two embryos; twiRNAi: n = 524 pulses, 106 cells, two embryos). (D) Twist is required to stabilize myosin II rings. Time-lapse images of myosin-GFP in embryos treated with arm dsRNA together with either twi or fog/t48 dsRNA. Bar, 5 µm. (E) Myosin-GFP (top and bottom, green) in live control or twiRNAi embryos. Images were segmented using intensity and area thresholds to identify myosin II structures (bottom, red). Bar, 10 µm. (F) Twist is required to form the supracellular actomyosin meshwork. The area of the largest myosin II structure was quantified for each time point in videos of control-injected or twiRNAi embryos.
Figure 9.
Figure 9.
Causes and consequences of contractile force integration. (A) Distribution of apical tensile forces that accompany ventral furrow formation. Black arrows indicate the movement of lateral cells toward the ventral midline. Red arrows indicate epithelial tension, which is predominantly directed along the length of the furrow (a-p axis). (B) Tissue-level forces influence individual cell shape changes. Ventral furrow cells attempt to constrict isotropically (black arrows), but a-p tension (red arrows) resists constriction in this direction, resulting in anisotropic constriction. (C) Model for how contractile forces are integrated to generate epithelial tension in the ventral furrow. In wild-type embryos, pulses of actin (red) and myosin II (green) contraction constrict cell apices, and actomyosin fibers that remain on the apical surface between pulses maintain cortical tension (black arrows above cells), thus stabilizing cell shape. Actomyosin fibers linked by spot AJs (blue) form a supracellular meshwork that allows forces to be stably transmitted between cells, generating global epithelial tension (red arrows). In the absence of Twist, cells lack actomyosin fibers between contractions and fail to assemble a supracellular actomyosin meshwork. Thus, contraction pulses in cells stretch their immediate neighbors, and tension fails to be propagated across the epithelium.

Similar articles

Cited by

References

    1. Adams C.L., Nelson W.J., Smith S.J. 1996. Quantitative analysis of cadherin-catenin-actin reorganization during development of cell–cell adhesion. J. Cell Biol. 135:1899–1911 10.1083/jcb.135.6.1899 - DOI - PMC - PubMed
    1. Arziman Z., Horn T., Boutros M. 2005. E-RNAi: a web application to design optimized RNAi constructs. Nucleic Acids Res. 33:W582–W588 10.1093/nar/gki468 - DOI - PMC - PubMed
    1. Bertet C., Sulak L., Lecuit T. 2004. Myosin-dependent junction remodelling controls planar cell intercalation and axis elongation. Nature. 429:667–671 10.1038/nature02590 - DOI - PubMed
    1. Blankenship J.T., Backovic S.T., Sanny J.S., Weitz O., Zallen J.A. 2006. Multicellular rosette formation links planar cell polarity to tissue morphogenesis. Dev. Cell. 11:459–470 10.1016/j.devcel.2006.09.007 - DOI - PubMed
    1. Buhl A.M., Johnson N.L., Dhanasekaran N., Johnson G.L. 1995. G alpha 12 and G alpha 13 stimulate Rho-dependent stress fiber formation and focal adhesion assembly. J. Biol. Chem. 270:24631–24634 10.1074/jbc.270.42.24631 - DOI - PubMed

Publication types

MeSH terms