. 2010 Mar 8;188(5):717-34.
doi: 10.1083/jcb.200911126. Epub 2010 Mar 1.

The novel endosomal membrane protein Ema interacts with the class C Vps-HOPS complex to promote endosomal maturation

Affiliations

The novel endosomal membrane protein Ema interacts with the class C Vps-HOPS complex to promote endosomal maturation

Sungsu Kim et al. J Cell Biol. .

Abstract

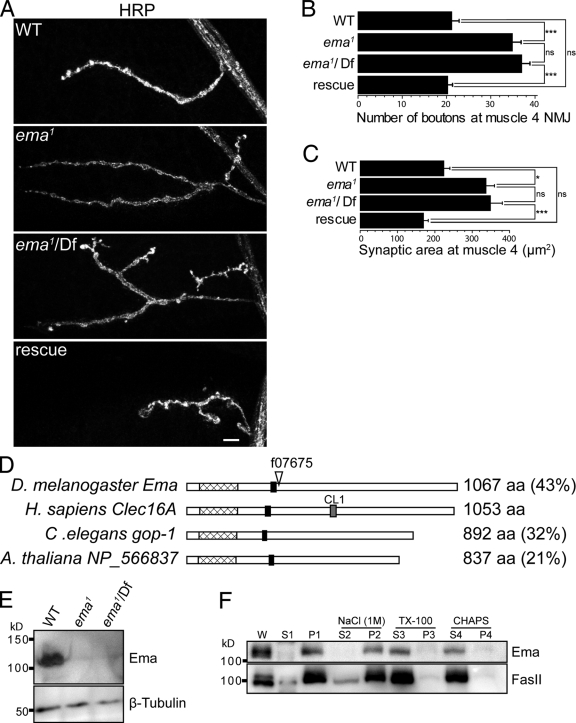
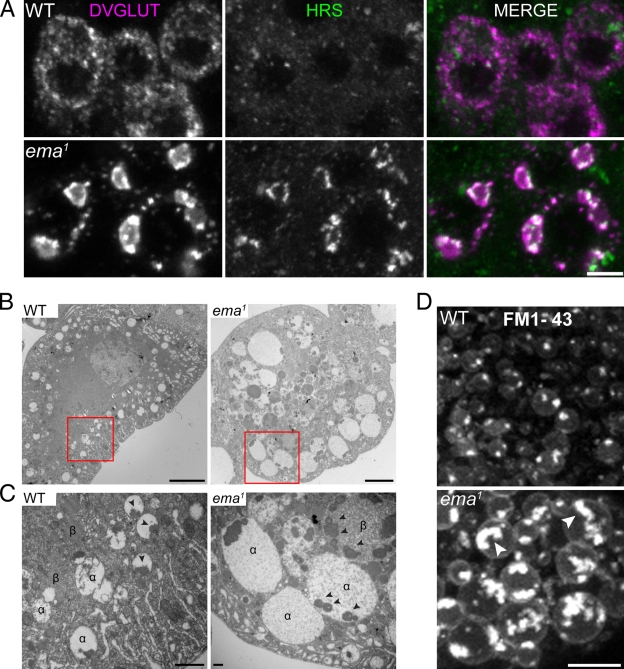
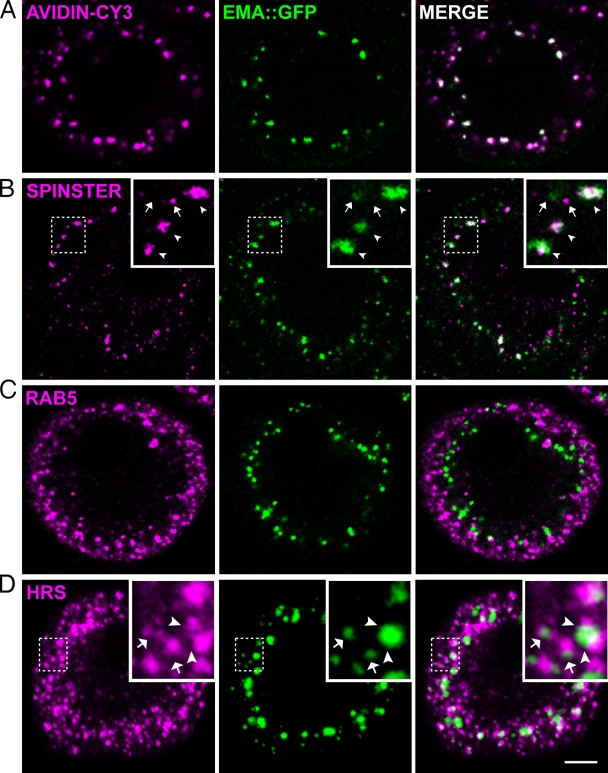
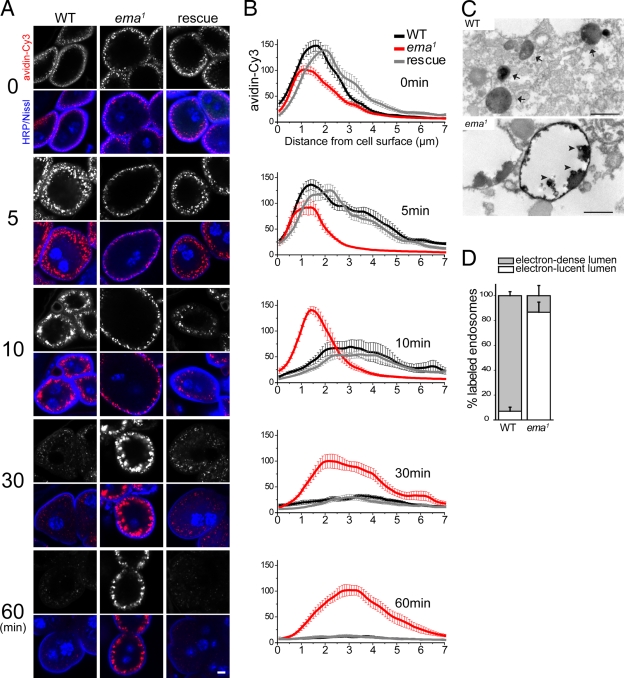
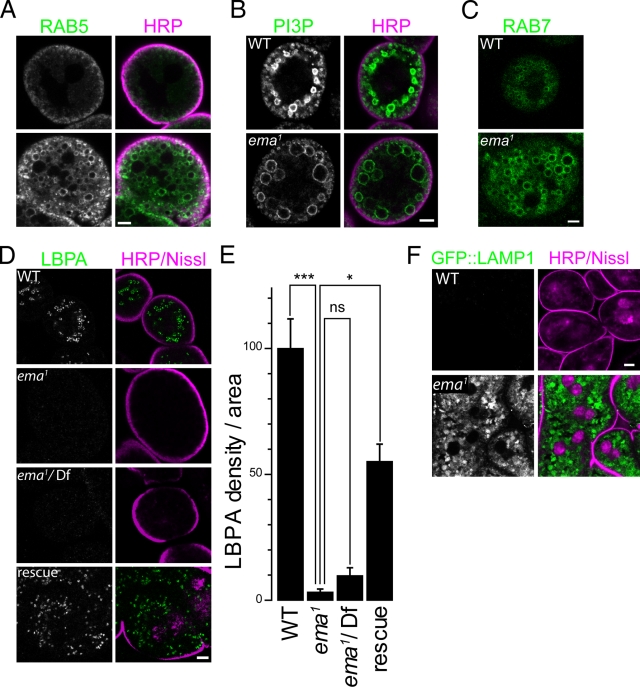
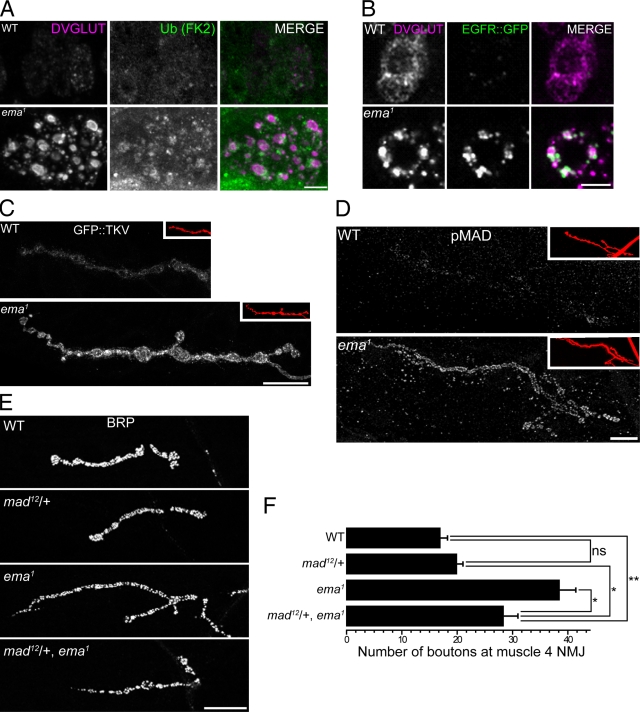
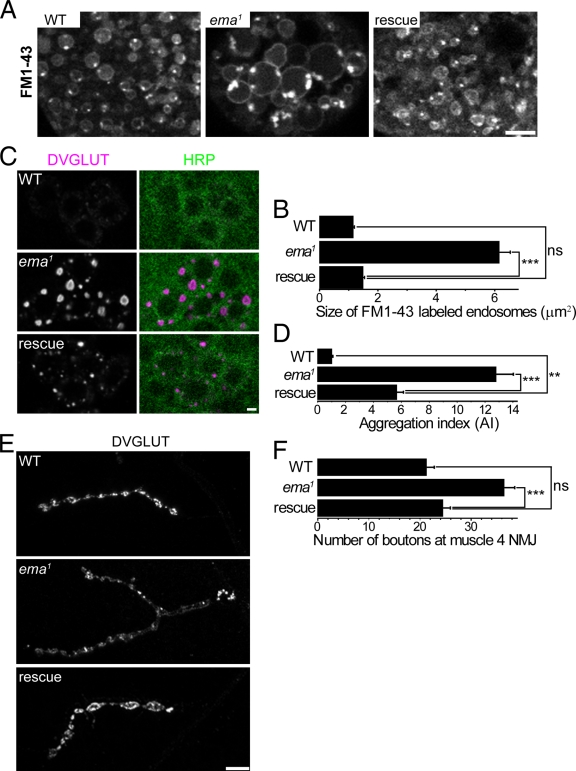
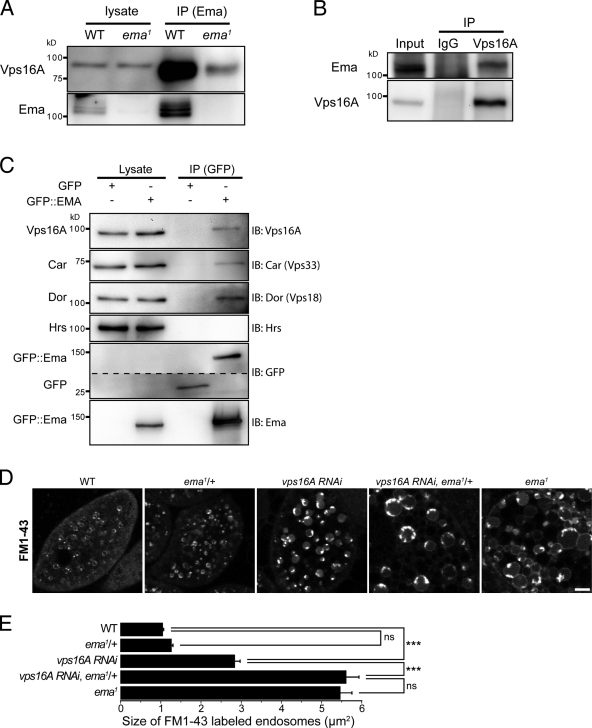
Endosomal maturation is critical for accurate and efficient cargo transport through endosomal compartments. Here we identify a mutation of the novel Drosophila gene, ema (endosomal maturation defective) in a screen for abnormal synaptic overgrowth and defective protein trafficking. Ema is an endosomal membrane protein required for trafficking of fluid-phase and receptor-mediated endocytic cargos. In the ema mutant, enlarged endosomal compartments accumulate as endosomal maturation fails, with early and late endosomes unable to progress into mature degradative late endosomes and lysosomes. Defective endosomal down-regulation of BMP signaling is responsible for the abnormal synaptic overgrowth. Ema binds to and genetically interacts with Vps16A, a component of the class C Vps-HOPS complex that promotes endosomal maturation. The human orthologue of ema, Clec16A, is a candidate susceptibility locus for autoimmune disorders, and its expression rescues the Drosophila mutant demonstrating conserved function. Characterizing this novel gene family identifies a new component of the endosomal pathway and provides insights into class C Vps-HOPS complex function.


Figures

Figure 1.
Figure 1.
Identification of the ema mutant. (A) Confocal images of larval NMJs from muscle 4 stained with an antibody to the neuronal membrane marker HRP reveal synaptic terminal overgrowth in the ema1 and ema1/Df mutants that is rescued by the neuronal expression of ema. WT (wild type) = Canton S; ema1 = CG12753 f07675; ema1/Df = CG12753 f07675/Df(3R)Exel7330; and rescue = ema1/Df; Elav-Gal4/UAS-EmaGFP. Bar, 10 µm. (B and C) Quantification is presented for the (B) number of synaptic boutons and (C) synaptic area (µm2) at muscle 4 for the genotypes shown in A; n > 10 for all genotypes. Data represent mean ± SEM. ANOVA analysis. *, P < 0.05; ***, P < 0.001; ns, not significant. (D) Schematic diagram of Ema orthologues highlighting the single putative transmembrane domain (black boxes), the highly conserved uncharacterized domain (pfam09758; hatched boxes), the C_type_lectin_1 domain signature (PS00615) in hClec16A (gray box), the percentage of sequence identity of each orthologue to human Clec16A, and the piggyBac insertion f07675 (∇) in the ema mutant. (E) Representative Western blots of third instar larval lysate from wild type, ema1, and ema1/Df probed for Ema and tubulin reveals the absence of Ema protein in the ema mutants. (F) Representative Western blots of Ema and the integral membrane protein FasII from fractionated wild-type cell lysates. Wild-type adult heads were homogenized (W) in a homogenization buffer (10 mM Hepes, pH 7.4, and 100 mM NaCl) and fractionated via centrifugation into soluble (S1) and insoluble (P1) membrane fractions. The P1 pellet was treated with either 1 M NaCl to extract peripherally associated proteins and then fractionated into soluble (S2) and insoluble (P2) fractions, or the nonionic detergent Triton X-100 (2%) and fractionated into soluble (S3) and insoluble (P3) fractions, or with the zwitterionic detergent CHAPS (4%) and fractionated into soluble (S4) and insoluble (P4) fractions. Both Ema and FasII are detergent extractable as predicted for integral membrane proteins.
Figure 2.
Figure 2.
The endosomal compartment is enlarged in the ema mutant. (A) Colocalization between DVGLUT aggregates and the endosomal ESCRT protein Hrs. Representative confocal images of motor neuron cell bodies stained for DVGLUT (magenta) and Hrs (green). Bar, 5 µm. (B) Transmission electron micrograph of third instar larval garland cells. Bar, 5 µm. (C) High magnification of insets from B. Electron-lucent α and electron-dense β vacuoles and intraluminal electron-dense granular aggregates (arrowheads) are indicated. Bar, 500 nm. (D) Representative live confocal images of garland cells labeled with the lipophilic styryl dye FM1-43. Brightly labeled lipophilic contents are indicated within the enlarged endosomal compartment in the mutant (arrowheads). Bar, 5 µm.
Figure 3.
Figure 3.
Ema localizes to endosomes. Representative single confocal sections of third instar larval garland cells labeled for Ema::GFP fusion protein (green) and endosomal markers (magenta), (A) the endocytic tracer avidin-Cy3 (pulse for 5 min and chase for 5 min), (B) the late endosomal and lysosomal protein Spinster, (C) the early endosomal protein Rab5, and (D) the early endosomal ESCRT protein Hrs. In insets of B, Ema puncta colocalize (arrowheads) or do not colocalize (arrows) with Spinster puncta. Insets of D depict partial overlapping (arrowheads) and directly adjacent (arrows) distributions between Ema and Hrs puncta. In D, the Ema channel (green) was enhanced by adjusting gamma output to visualize weak Ema puncta. Bar, 5 µm.
Figure 4.
Figure 4.
Defective endosomal trafficking in the ema mutant. (A and B) Endosomal trafficking of the fluorescent endocytic tracer avidin-Cy3. Garland cells were incubated with avidin-Cy3 for 5 min and chased for the indicated time period (min). (A) Representative confocal images of garland cells traced with avidin-Cy3 (red) and stained for the plasma membrane marker HRP (blue) and nuclear marker Nissl (blue). Bar, 5 µm. (B) Line-depth intensity plot of avidin-Cy3 tracer. (Black) wild type (Canton S), (red) ema1, and (gray) rescue (ema1; Actin5C-Gal4/UAS-EmaGFP). n > 10 for all genotypes at all chase times. Data represent mean ± SEM. (C and D) Ultrastructural analysis of endosomal trafficking of the endocytic tracer HRP in garland cells. (C) Representative transmission electron micrograph of HRP-labeled endosomes, with electron-dense lumen in wild type (arrow) and electron-lucent lumen in mutant. Electron-dense HRP tracers highlight the limiting membrane and intraluminal protrusions (arrowheads) in mutant. Bar, 500 nm. (D) Quantification of HRP-labeled endosomes. n = 191 for 8 wild-type cells; n = 16 for 6 mutant garland cells. Data represent mean ± SEM.
Figure 5.
Figure 5.
Endosomal maturation is disrupted in the ema mutant. (A–D and F) Representative confocal images of garland cells labeled for (A) the early endosomal Rab5::GFP fusion protein, (B) the early endosomal phospholipid PI3P by a FYVE::GFP fusion protein, (C) the late endosomal Rab7::GFP fusion protein, (D) the late endosomal and lysosomal phospholipid LBPA by a monoclonal α-LBPA antibody, and (F) the GFP::LAMP1 fusion protein. Cells were co-labeled for plasma membrane (HRP/magenta) and/or nuclei (Nissl/magenta) except in C, where live imaging was taken for Rab7::YFP. Rescue genotype in D is ema1; actin5C-Gal4, UAS-Ema::GFP. Bar, 5 µm. (E) Quantification of LBPA level in garland cells for the genotypes in D. Total LBPA density per cell area was measured. Data represent mean ± SEM. ANOVA analysis. *, P < 0.05; ***, P < 0.001; ns, not significant.
Figure 6.
Figure 6.
Up-regulated BMP signaling promotes synaptic overgrowth in the ema mutant. (A and B) Endolysosomal trafficking of membrane receptor cargos in motoneurons. Representative confocal images of motoneuron cell bodies labeled for (A) ubiquitinated proteins by a monoclonal α-FK2 antibody (green) or (B) EGFR::GFP fusion protein (green) and for DVGLUT protein (magenta). Bar, 5 µm. (C and D) Distribution of BMP signaling components at the NMJs. Representative confocal images of muscle 4 type 1b NMJs labeled for (C) neuronally expressed GFP::TKV fusion protein and (D) endogenous pMAD protein. In insets, the NMJs are visualized by the neuronal membrane marker HRP (red). Bar, 20 µm. (E and F) A mad mutation dominantly suppresses the synaptic overgrowth in ema. (E) Representative confocal images of wild type (WT), a heterozygous mad mutant (mad12/+), ema1, and mad12/+, ema1 NMJs labeled for the presynaptic protein BRP. Bar, 20 µm. (F) Quantification of number of synaptic boutons at the muscle 4 NMJs for the genotypes in E. n > 10 for all genotypes. Data represent mean ± SEM. ANOVA analysis. *, P < 0.05; **, P < 0.01; ns, not significant.
Figure 7.
Figure 7.
Human Clec16A rescues ema. (A and B) Human Clec16A rescue of enlarged endosomes in the ema mutant garland cells. (A) Representative confocal images of live FM1-43–labeled endosomes from wild-type (WT), ema1, and rescue (ema1; actin5C-Gal4, UAS-GFP::hClec16A) garland cells. (B) Quantification of the size of live FM1-43–labeled endosomes for the genotypes in A. n > 200 for all genotypes. (C and D) Human Clec16A rescue of DVGLUT aggregates in the ema mutant motoneurons. (C) Representative confocal images of wild-type (WT), ema1, and rescue (BG380-Gal4, UAS-GFP::hClec16A; ema1) motoneuron cell bodies labeled for DVGLUT protein (magenta) and the neuronal membrane marker HRP (green). Bar, 2 µm. (D) Quantification of DVGLUT aggregation for the genotypes in C. Aggregation index (AI) of a motor neuron = total DVGLUT density × average size of DVGLUT aggregates in that neuron. n > 30 for all genotypes. (E and F) Human Clec16A rescue of synaptic overgrowth at the ema mutant NMJs. (E) Representative confocal images of wild-type (WT), ema1, and rescue (BG380-Gal4, UAS-GFP::hClec16A; ema1) type Ib NMJs at the muscle 4 labeled for DVGLUT protein. The ema1 image was taken at a higher gain for clarity. Bar, 10 µm. (F) Quantification of number of type Ib synaptic boutons at muscle 4 for the genotypes in E. n > 10 for all genotypes. For B, D, and F, data represent mean ± SEM. ANOVA analysis. **, P < 0.01; ***, P < 0.001; ns, not significant.
Figure 8.
Figure 8.
Ema interacts with the class C Vps–HOPS complex. (A and B) Reciprocal coimmunoprecipitation between endogenous Ema and Vps16A proteins. (A) Western blots for Vps16A and Ema of the immunocomplex isolated with an α-Ema antibody from whole-cell lysates of wild-type and ema mutant third instar larvae. (B) Western blots of Ema and Vps16A of the immunocomplex isolated with either the α-Vps16A antibody or control IgG from whole-cell lysates of wild-type adult fly heads. (C) Coimmunoprecipitation between Ema::GFP fusion protein and endogenous proteins of the class C Vps–HOPS complex. Western blots for Vps16A, Car, Dor, Hrs, Ema, and GFP of the immunocomplex isolated with an α-GFP antibody from whole-cell lysates of third instar larvae expressing either Ema::GFP fusion protein or GFP alone. (D and E) Genetic interaction of ema and vps16A for enlarged endosomes. (D) Representative confocal images of live FM1-43–labeled endosomes of wild-type (WT), a heterozygote ema mutant (ema1/+), Vps16A knockdown (vps16A RNAi/+; daGal4/+), a Vps16A knockdown in the heterozygote ema mutant (vps16A RNAi/+; daGal4/+; ema1/+), and ema1 garland cells. Bar, 5 µm. (E) Quantification of the size of live FM1-43–labeled endosomes (µm2) for the genotypes in D. n > 500 endosomes from at least 10 cells for all genotypes. Data represent mean ± SEM. ANOVA analysis. ***, P < 0.001; ns, not significant.

References

    1. Awata T., Kawasaki E., Tanaka S., Ikegami H., Maruyama T., Shimada A., Nakanishi K., Kobayashi T., Iizuka H., Uga M., et al. ; Japanese Study Group on Type 1 Diabetes Genetics. 2009. Association of type 1 diabetes with two Loci on 12q13 and 16p13 and the influence coexisting thyroid autoimmunity in Japanese. J. Clin. Endocrinol. Metab. 94:231–235. 10.1210/jc.2008-0718 - DOI - PubMed
    1. Banta L.M., Robinson J.S., Klionsky D.J., Emr S.D.. 1988. Organelle assembly in yeast: characterization of yeast mutants defective in vacuolar biogenesis and protein sorting. J. Cell Biol. 107:1369–1383. 10.1083/jcb.107.4.1369 - DOI - PMC - PubMed
    1. Bökel C., Schwabedissen A., Entchev E., Renaud O., González-Gaitán M.. 2006. Sara endosomes and the maintenance of Dpp signaling levels across mitosis. Science. 314:1135–1139. 10.1126/science.1132524 - DOI - PubMed
    1. Bonifacino J.S., Rojas R.. 2006. Retrograde transport from endosomes to the trans-Golgi network. Nat. Rev. Mol. Cell Biol. 7:568–579. 10.1038/nrm1985 - DOI - PubMed
    1. Budnik V., Koh Y.H., Guan B., Hartmann B., Hough C., Woods D., Gorczyca M.. 1996. Regulation of synapse structure and function by the Drosophila tumor suppressor gene dlg. Neuron. 17:627–640. 10.1016/S0896-6273(00)80196-8 - DOI - PMC - PubMed

Publication types

MeSH terms